Introduction
Private market investments are making up an increasingly larger share of institutional and individual portfolios. Private market investments can generate a return premium to public markets but require tradeoffs in liquidity, fees, and complexity. In this quarterly report, NEPC’s investment team outlines our views on private markets. As always, we remain committed to helping our clients successfully run private market investment programs in the face of uncertainty and change.
Private markets strategies today exhibit many common themes:
- Liquidity: In NEPC’s view, exit activity has picked up over the course of 2026 in part because continuation vehicles (including second generation continuation vehicles), secondary sales, and other structured transactions served as key liquidity levers for general partners (GPs). In our observation, secondary sales have become increasingly common for limited partners (LPs), serving as largely destigmatized tools for portfolio management. Across private equity, exit value increased about 50% in the third quarter¹ from the prior quarter; still, Pitchbook estimates that about a third of sponsor-owned companies have been held for more than five years.² This is leading many LPs to reassess the relevance of historical assumptions around growth rates and fund lives across private market strategies.
- Flight-to-quality: In NEPC’s view, activity across fundraising, deal-making and exits is increasingly concentrated among larger GPs and bigger transactions across private equity, private debt and real assets. Pitchbook data shows that buyout funds of $1 billion or more have accounted for approximately 83% of capital raised through the third quarter,³ and estimates that the 10 largest funds alone may capture over 40% of private equity commitments in 2026.⁴ We believe this dynamic reflects an ongoing preference for perceived quality, which has made the upper end of the market more competitive. At the same time, NEPC sees more compelling relative opportunities in smaller funds and transactions across credit, equity and real assets where competition appears less intense.
- Artificial intelligence: In NEPC’s view, artificial intelligence is increasingly connecting the venture capital, buyouts, private credit, real estate, infrastructure, and energy sectors. AI continues to reshape the venture market, with AI companies capturing over 80% of U.S. venture deal value through the three months ended September 30.⁵ However, exposures in LP portfolios include not only AI models and software, but also data centers, semiconductors, electrical generation, transmission, cooling systems, fiber networks and the financing required to build those assets. While managers continue to find opportunities in AI, growing concentration within the sector (especially in venture) also presents potential risks. We believe AI-related valuations continue to rise, reinforcing the need for a disciplined approach that distinguishes high-quality investments from those driven primarily by broader market enthusiasm.
-
Rise of wealth: Individual investors are increasingly seeking exposure to private markets in their portfolios via rapidly expanding semi-liquid vehicles. Morningstar issued its inaugural ratings of semi-liquid funds in September 2025, further cementing the theme of public and private market convergence⁶. Morningstar estimates that private equity evergreen funds have seen net assets more than double from the end of 2024 through September 30, 2026.⁷
-
Industry consolidation: In NEPC’s view, ongoing consolidation underscores a maturing private markets landscape. We believe many of these transactions are being framed around themes such as democratizing access to private markets, enhancing valuation multiples through expanded offerings of alternatives, or providing liquidity to GPs for succession planning and growth. In our perspective, recent examples, including Goldman Sachs’ acquisition of Industry Ventures, and BlackRock’s acquisitions of Global Infrastructure Partners and HPS Private Credit reflect these broader trends.
1 Source: PitchBook, as of September 30, 2026.
2 Source: https://pitchbook.com/news/reports/q3-2026-private-equitys-zombie-problem>
3 Source: PitchBook, as of September 30, 2026.
4 Source: https://pitchbook.com/news/reports/2026-us-private-equity-outlook-midyear-update
5 Source: https://nvca.org/pitchbook-nvca-venture-monitor/?gf_page_2=1
Buyouts
Buyouts continue to play a core role in private markets portfolios, although the market remains more challenging than it was during the low-rate period. Transaction activity is improving as sponsors and lenders adjust to higher financing costs and more conservative capital structures, but the recovery remains uneven. In NEPC’s view, the current environment favors managers that are disciplined in entry valuations, can underwrite investments across a range of economic outcomes, and have the operational capabilities to create value without relying on financial engineering or multiple expansion.
Liquidity remains the primary challenge for the asset class. Exit activity is improving, but the backlog of aging portfolio companies continues to weigh down distributions, fundraising, and capital recycling. Many sponsors are balancing the need to return capital with a reluctance to sell stronger assets in an inconsistent exit environment. As a result, NEPC expects liquidity to come from a mix of strategic sales, sponsor-to-sponsor transactions, continuation vehicles, recapitalizations, and other structured solutions as the IPO market recovers. These options can provide additional flexibility, but ultimately managers will need to generate realizations and return capital to investors.
NEPC’s buyout team continues to see relative opportunities in the lower-middle market, where managers have higher potential to create value through operational improvement, margin expansion, professionalization, and buy-and-build strategies. This segment can also offer a broader range of potential exit paths and is generally less reliant on highly leveraged capital structures. Manager selection remains critical, with an emphasis on differentiated sourcing, sector expertise, operational capabilities, and a demonstrated ability to realize investments across market environments.
Market Anecdotes
- On July 29, 2026, Jersey Mike’s Subs priced its IPO at $23 per share, raising approximately $1 billion and valuing the company at roughly $7.3 billion. The Blackstone-backed company’s public listing represents a meaningful private equity liquidity event and provides an encouraging example of the IPO market serving as a viable exit path for sponsor-owned companies amid a broader backlog of assets awaiting realization.⁸
- In October 2026, Goldman Sachs and Evercore were reported to be exploring evergreen continuation funds that could allow private equity firms to hold assets for 10-to-15 years or longer. The structure could provide sponsors with an additional liquidity alternative as traditional exits remain constrained, allowing existing investors to realize proceeds while managers retain high-quality assets beyond traditional fund lives.⁹
- Evergreen private equity funds have grown rapidly, with assets increasing to $107.7 billion as of June 30, 2026, from $21.8 billion at the end of 2022. Growth has accelerated following the launches of vehicles from Blackstone and KKR, with Carlyle, Vista and TPG among the managers subsequently expanding into the market as private equity seeks to broaden access to private wealth capital¹⁰.
Performance
- North American buyout performance remained positive in the second quarter of 2026, returning 4.47%, but moderated from more recent quarters, representing the second-lowest quarterly return since performance bottomed in the fourth quarter of 2022, ahead of only the 2.05% return in the first quarter of 2023.
- The moderation reinforces a more normalized return environment, with less support from multiple expansion, and greater reliance on earnings growth and operational improvement.
- Despite softer near-term performance, a more constructive transaction environment may support realizations, though the backlog of aging assets remains a constraint.
 Fundraising¹¹
 Fundraising¹¹
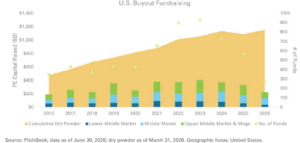
- U.S. private equity fundraising remains subdued, with buyout managers raising $222.0 billion across 275 funds through the third quarter. Fund count remains well below recent years, reflecting a more selective fundraising environment.
- Fundraising timelines remain extended, with U.S. private equity funds taking an average of 16.2 months to close, compared with 15.4 months in 2025 and 13.4 months in 2021.
- Larger funds continue to capture an outsized share of commitments, with funds of $1 billion or more accounting for approximately 83% of capital raised through the third quarter.
- Despite a challenging fundraising environment, managers successfully returning to market continue to raise larger successor funds, with the median buyout fund-size step-up reaching approximately 1.43x in 2026, versus 1.40x in 2025, and 1.38x in 2024.
Deal Activity12
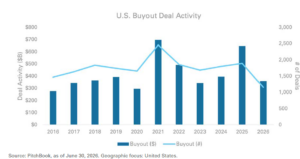
- U.S. buyout deal activity totaled $357.5 billion across 1,151 transactions through the three quarters ended September 30, as dealmaking continued at a healthy but more moderate pace relative to recent peak years.
- Activity slowed in the third quarter, with 299 platform buyouts completed during this period, down from 406 in the second quarter, and 446 in the first quarter, highlighting continued selectivity around new platform investments.
- Add-ons remain a significant component of activity, representing approximately 75% of U.S. buyout deal count through the third quarter, consistent with the elevated levels seen over the past several years.
- Carve-outs have become a larger source of opportunity, accounting for approximately 13% of U.S. private equity deal value through the third quarter, up from around 9% in 2025, and the highest annual share in the dataset.
Valuations¹³
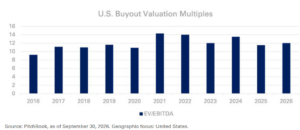
- Median U.S. buyout entry valuations increased to 12.0x EV/EBITDA through the third quarter, up from 11.5x in 2025, indicating that pricing has moved higher as transaction activity has improved.
- Despite the recent increase, entry valuations multiples remain below the 13.0x five-year average and the 14.3x peak reached in 2021. Valuations have moderated from prior-cycle highs but remain elevated, underscoring the need for discipline in entry pricing.
- Higher entry multiples can create a more challenging return environment by leaving less room for multiple expansion over the investment period. As a result, earnings growth, margin improvement, and operational value creation are likely to play a greater role in generating returns.

Exits¹⁴
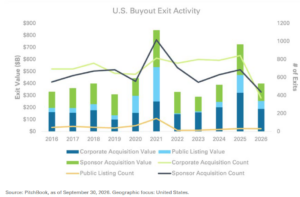
- U.S. buyout exit value reached $398.8 billion through the third quarter, already exceeding full-year exit value in 2022, 2023 and 2024, signaling a meaningful improvement in the overall liquidity environment.
- Exit activity improved meaningfully in the three months ended September 30, with both exit value and deal count increasing from the prior quarter, as sponsors continued to bring assets to market despite an uneven backdrop.
- Liquidity remains concentrated in larger transactions, with mega-exits accounting for 73.3% of total U.S. private equity exit value through the third quarter, indicating that the broader backlog of sponsor-owned companies has yet to experience the same level of activity.
- Strategic buyers were a key source of liquidity in the third quarter, with corporate acquisitions generating $86.6 billion—or more than half of quarterly exit value—while public listings contributed $19.0 billion, or approximately 11%. The difference highlights the continued importance of strategic M&A as a source of liquidity while the IPO market remains more selective.
6 Source: https://newsroom.morningstar.com/newsroom/news-archive/press-release-details/2025/Morningstar-Publishes-First-
7 Source: https://www.morningstar.com/business/insights/research/evergreen-fund-market-trends
8 https://www.reuters.com/world/restaurant-chain-jersey-mikes-prices-ipo-23-per-share-sources-2026-07-29
9 https://www.reuters.com/world/restaurant-chain-jersey-mikes-prices-ipo-23-per-share-sources-2026-07-29
10 Pitchbook, Q3 2026 Evergreen Fund Landscape Report
11 Source: PitchBook as of September 30, 2026
12 Source: PitchBook as of September 30, 2026
13 Source: PitchBook as of September 30, 2026
14 Source: PitchBook as of September 30, 2026
Venture Capital
Venture capital can be an important source of long-term returns within a diversified investment program, but outcomes remain highly dependent on manager selection, stage, and portfolio construction. The market is showing renewed momentum, although activity and performance remain concentrated among a relatively small group of companies and established managers rather than reflecting a broad-based recovery. In NEPC’s view, this environment reinforces the importance of access to managers that can identify attractive companies early, maintain meaningful ownership as they scale, and manage the high dispersion of outcomes inherent in venture investing.
Liquidity remains uneven and continues to shape portfolio management and fundraising. Public listings and acquisitions have improved selectively, but the backlog of mature private companies remains significant, and distributions vary widely across managers. Until exit activity broadens, reported performance will continue to depend heavily on unrealized valuations rather than actual cash returned to investors. NEPC believes this environment favors managers that are realistic about exit timing, disciplined in managing reserves, and willing to make portfolio decisions based on company fundamentals rather than prior valuation expectations.
Artificial intelligence continues to reshape the venture market, creating opportunities across applications, infrastructure, and enabling technologies. At the same time, rising valuations, capital intensity, rapid product cycles, and uncertainty along long-term economics create additional risk for investors. NEPC believes selectivity is key, with an emphasis on managers that can distinguish businesses with durable competitive advantages from those benefiting primarily from broader enthusiasm around AI.
Market Anecdotes
- On September 3, 2026, NVIDIA agreed to acquire Hugging Face for approximately $12.9 billion, adding the open-model and AI developer platform to its broader AI ecosystem¹⁵.
- On September 28, 2026, AMD agreed to acquire World Labs for approximately $8.2 billion, adding the spatial-intelligence AI company and its research capabilities as AMD expands its focus on emerging AI applications¹⁶.
- On June 16, 2026, SpaceX formalized its agreement to acquire Cursor for $60 billion in stock, representing a significant strategic exit for the venture-backed AI coding company¹⁷.
- On August 19, 2026, Stripe announced its agreement to acquire OpenRouter, an AI model-routing platform providing access to more than 400 models from over 80 providers. The transaction highlights continued strategic interest in the infrastructure supporting enterprise AI adoption¹⁸.
Performance
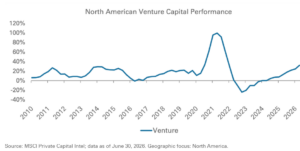
- Venture capital’s rolling one-year return increased to 32.02% as of the second quarter, up from24.54% in the first quarter, and 12.93% a year earlier. Performance has now improved for eight consecutive quarters, marking a significant recovery from the 2022–2023 valuation reset.
- Despite the recent strength, venture returns remain below the exceptional levels reached in 2020 and 2021, suggesting a more normalized recovery from the prior cycle.
- Performance remains concentrated, particularly within AI, while limited IPO and M&A activity continues to constrain distributions. Manager outcomes are likely to remain highly dependent on vintage, stage, access, and ownership in category-leading companies.
Fundraising19
- North America venture managers raised $108.5 billion across 699 funds through the third quarter,
already exceeding the $78.3 billion raised in 2025 despite a lower number of fund closes. - Growth equity fundraising has remained more subdued, with $19.6 billion raised across 73 funds through the third quarter, compared with $50.7 billion across 105 funds in 2025.
- Venture fundraising remains highly concentrated, with 26 funds of $1 billion or more raising $73.7
billion, or approximately 68% of total venture capital, raised through the third quarter. - First-time fundraising remains challenging, with new venture managers raising $4.9 billion across 81 funds through the third quarter, compared with $9.4 billion across 195 funds in 2025.
 Deal Activity20
 Deal Activity20
- North America venture deal value reached $515.8 billion across 11,800 deals through the third quarter, well above the $319.7 billion invested in 2025.
- Activity moderated sharply during the third quarter, with $98.4 billion invested, down from $163.9 billion in the second quarter, and $253.5 billion in the first quarter, highlighting the impact of unusually large financings earlier in the year.
- AI continues to dominate venture investment, accounting for $426.7 billion, or 82.7% of total U.S. venture deal value through the third quarter, compared with 67.0% in 2025.
- The concentration in AI is significantly greater by deal value than by deal count: AI represented approximately 45% of venture deal count but more than 80% of deal value in the third quarter, reflecting the outsized financing requirements and transaction sizes of leading AI companies.
 Valuations21
 Valuations21
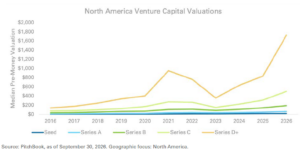
- Median North America venture pre-money valuations continued to increase through the third quarter, with valuations rising across Series A through later-stage rounds. Series C and D+ financings experienced the most significant increases, while earlier-stage valuations moved higher at a more moderate pace.
- The rise in late-stage valuations raises the bar for future returns, as companies entering at higher valuations must sustain strong growth that ultimately supports higher exit values. This places greater emphasis on underwriting discipline, company fundamentals, and the ability of managers to maintain meaningful ownership in their strongest investments.

Exits22
 North America venture exit value reached $2.3 trillion across 1,115 exits in the third quarter,
significantly exceeding recent annual totals. However, the headline figure is heavily influenced by a small number of exceptionally large exits and should not be viewed as a broad-based normalization of venture liquidity.- IPOs have been the primary driver of exit value, generating approximately $1.8 trillion across 58 public listings in the third quarter. During this period, IPO activity slowed considerably, with 18 listings generating less than $10 billion of exit value, highlighting the concentration of value in earlier large transactions.
- Exit value is similarly concentrated by sector. B2B accounted for approximately $1.7 trillion of yearto-date exit value, while software generated nearly $400 billion, leaving other sectors responsible
for a comparatively small share of aggregate liquidity. - Outside of public listings, acquisitions remain an important source of liquidity, generating approximately $465 billion of exit value in the third quarter. The continued importance of M&A provides an additional exit path, though the concentration of overall exit value indicates that liquidity has yet to broaden evenly across the venture market.
 North America venture exit value reached $2.3 trillion across 1,115 exits in the third quarter,
15 https://www.bbc.com/news/articles/cr4vnr5g1k7o
16 https://www.wsj.com/tech/ai/amd-to-acquire-world-labs-for-8-2-billion-a8d03d11
17 https://www.cnbc.com/2026/06/16/spacex-spcx-cursor-acquisition-ipo.html
18 https://www.bloomberg.com/news/articles/2026-08-16/stripe-nears-deal-to-buy-ai-firm-openrouter-for-over-7-billion
19 PitchBook as of September 30, 2026
20 Source: Pitchbook as of September 30, 2026.
21 Source: PitchBook as of June 30, 2026
22 Source: Pitchbook as of September 30, 2026.
Private Credit
At NEPC, we have observed private credit strategies gain prominence over the last decade as banks and other financial institutions have scaled back their lending activity. Many institutional investors have significant allocations to private credit, taking advantage of higher yields and total returns, while enjoying a premium to public markets and flexibility around portfolio construction with shorter fund lives than private equity.
Private credit is more than just direct lending; other investment strategies include opportunistic/transitional capital, junior debt, and strategies focused on collateral outside of corporate credit, including asset-based lending. Borrowers include private companies and private equity sponsored companies, and the demand for capital continues to grow. As long-standing private credit investors, NEPC is focused on the following themes:
Market Anecdotes
- Liquidity continues to become a defining issue. Redemption requests, BDC portfolio sales and continuation vehicles highlight the importance of distinguishing asset-level liquidity from fund-level liquidity. Business development companies (BDCs) continue to face elevated redemption activity. Redemption requests generally continue to exceed the 5% quarterly gates on most funds.
- BCRED redemption requests were stable quarter over quarter at 10%, up from 7% in the first quarter. HPS HLEND redemption requests declined to 11.5% in the third quarter from 13.3% in the second quarter but remained above the 9.25% level recorded in the first quarter. Similarly, Cliffwater CCLFX redemption requests declined to 16% in the third quarter relative to 17% in the prior quarter, though they remained above the 14% reported in the first quarter.²³ ²⁴ That said, redemption caps are being enforced broadly, and institutional demand for perpetual vehicles remains strong.
- The private credit secondaries market, including continuation vehicles, continues to grow. Secondary volume reached $20 billion in the first half of 2026, already exceeding the full-year 2025 total. Pricing across these deals reflects a bifurcated market and strong demand for high-quality portfolios. Earlier in the year, HarbourVest led a continuation vehicle involving a $730 million Willow Tree portfolio, priced at a premium to its December 31, 2025, fair value. BlackRock TCP Capital transferred a portfolio of middle-market loans into a continuation vehicle (Pantheon was the majority buyer). The transaction was intended to reduce leverage and provide liquidity following significant NAV pressure and scrutiny of portfolio valuations. There have been a handful of continuation vehicles priced at a premium to par over the past year, but secondaries investors are still able to achieve an effective discount via structural mechanics such as delayed settlements.
- Too much capital chasing too few deals is leading to spread compression in the direct lending market. Competition for attractive borrowers has driven many non-software loans down below SOFR plus 500 basis points. New issue LBOs financed in the direct lending market are pricing in the 450 basis points to 499 basis points range (54%) or 500 basis points to 549 basis points range (32%) YTD 2026.²⁵ Therefore, investors are rotating capital into more specialized areas of the private credit market where there is reduced competition such as asset-backed lending.
- Software is no longer the market darling. The sector has lost share of new origination, accounting for 12% of all private equity-backed direct lending deals by count, year-to-date 2026, down from 16% last year. Meanwhile, healthcare accounted for 20% of new-issue direct lending deals in 2026, up from 18% in 2025.²⁶
Performance27
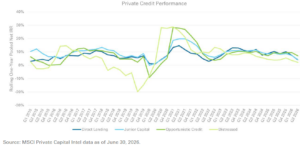
- Base rates for floating-rate loans are tied to the secured overnight financing rate (SOFR), which stands at 3.75% to 4% on the heels of the Federal Open Market Committee’s decision on September 16th to increase rates by 25 basis points. Floating-rate loans include first lien, unitranche and broadly syndicated loans (BSLs).
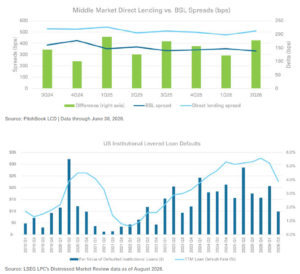
- Average all-in yields for middle-market direct lending deals (including first-lien and uni-tranche) increased slightly to 9.61% in the third quarter (vs. 9.25% in the second quarter).
- The yield premium for large corporate direct lending deals compared to the broadly syndicated market widened to 256 basis points in the third quarter.
- Average spreads on first-lien middle-market direct lending were slightly wider quarter-over quarter at 515.75 basis points in the third quarter.
- BSL spreads were modestly tighter quarter over quarter, at 347 basis points, in the third quarter.
Fundraising28
- Fundraising momentum is strong, but for scaled, experienced funds.
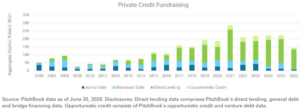
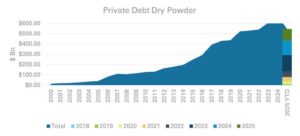
- As of June 30, funds that held their final close in the first half of 2026 raised $157.7 billion in aggregate, according to PitchBook data. Globally, 2026 fundraising across all private debt strategies is trending higher year-over-year, but megafunds are dominating this activity (56.9% of private debt funds raised globally) and fund count is down 34% year-over-year.
- Emerging managers represented 5.5% of U.S. capital raised (record low).29
- Direct lending continues to hold the largest share of capital raised in the quarter, though there has been meaningful fundraising across multi-strategy and opportunistic credit mandates. This dynamic highlights investors’ growing appetite for more specialized segments of the private credit market.
- Across the large non-traded private credit BDCs, the largest 12 received approximately $19.1 billion of withdrawal requests in the second quarter. Only $7.6 billion was actually paid, with most funds employing their quarterly redemption caps.³⁰
Deal Activity31
- Direct lending activity picked up in the third quarter, with sponsor-backed direct lending volume increasing 31% quarter-over-quarter to $27.4 billion.
- Middle-market LBOs also rebounded, increasing 54% from the second quarter to $11.6 billion.
- That said, activity for the year remains 23% below 2025 levels.
- The growth of AI is creating demand for private capital to fund the required infrastructure. Nvidia is partnering with Apollo, BlackRock, Blackstone, Brookfield, Goldman Sachs and KKR on financing platforms targeting more than $500 billion of third-party capital for AI computing infrastructure.
- As of June 30, the software sector makes up 22.2% of the total BDC universe, and 35.6% of borrowers ‘under pressure’. ‘Under pressure’ is broadly defined by a swath of indicators that signal credit deterioration (i.e., maturity extension, increase in pay-in-kind, fair value increased by more
than five points year-over-year).
Source: PitchBook data as of December 31, 2025.
Valuations
- Across the largest publicly traded BDCs, distressed debt (positions marked below 80% of cost) increased from 3.2% to 5.2% of debt year-over-year.³²
- The stress is disproportionately concentrated in certain legacy software credits, particularly junior debt and 2021-22 vintage transactions.
Exits
- The technology sector remains the largest source of defaulted volume year-to-date at $9.6 billion.27
- The trailing 12-months leveraged loan default rate declined through the first half of the year before stabilizing at 3.9% through September 2026.27
- Chemicals and services at $8.6 billion and $8.5 billion respectively, followed technology in default volume.27
23 PitchBook Record Redemptions, October 2026
24 PitchBook 3Q26 US Private Credit & Middle Market Quarterly Wrap
25 PitchBook 3Q26 US Private Credit & Middle Market Quarterly Wrap
26 PitchBook 3Q26 US Private Credit & Middle Market Quarterly Wrap
27 LSEG LPC Middle Market Connect: The Middle Market Opportunity (published October 2026). Data coverage 3rd quarter 2026.
28 PitchBook H1 2026 Global Private Debt Report; data as of June 30, 2026.
29 PitchBook H1 2026 Global Private Debt Report; data as of June 30, 2026.
30 PitchBook 3Q26 US Private Credit & Middle Market Quarterly Wrap
31 LSEG LPC Middle Market Connect: The Middle Market Opportunity (published October 2026). Data coverage 3rd quarter 2026.
32 PitchBook 3Q26 US Private Credit & Middle Market Quarterly Wrap
Real Estate
Private real estate can play multiple roles in a portfolio, ranging from income-oriented core and coreplus strategies, to total-return-seeking opportunistic approaches. In recent years, real estate has experienced swings in valuations driven by the rapid fall and rise in interest rates, while recent quarters have been relatively stable with appreciation returns generally flattening. As such, liquidity has improved, but many real estate investors continue to hold out for more favorable pricing which has slowed distributions to investors. With the recent increases in 10-year Treasury yields, appraisers have signaled that they may assign further write-downs in the coming quarters. Fundamentals within certain sectors remain strong with low supply, recent leasing activity, and demographic tailwinds; however, capital markets challenges are still evident.
Market Anecdotes
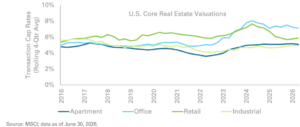
- Real estate valuations, represented by transaction cap rates, continue to show signs of stability after years of uncertainty. Apartment and industrial assets have recently been transacting around 5%, and the rolling four-quarter average for retail and office continues to stabilize; however, appraisers have continued to value assets at tighter cap rates,³³ signaling that further write-downs may be imminent.
- Industrial remains the healthiest of the traditional real estate property sectors. Leasing activity was up 38.5% year-over-year and 15.3% quarter-over-quarter in the third quarter, climbing to 202.6 million square feet, representing the strongest quarterly total since 2022. 2026 year-to-date netabsorption is 231.6 million square feet, which represents more than the 2025 calendar year, with national vacancy at a low 6.8%.³⁴
- Senior housing continues to show positive tailwinds for asset owners. Occupancy in the third quarter surpassed 90% for the first time since 2014 as the number of new units built is substantially lower than forecasted demand.³⁵
Performance
- Public and private real estate moved in opposite directions in the third quarter. The ODCE³⁶ posted a preliminary 1.71% gross return, it’s strongest since the 2022 hike in interest rates. Conversely, over the same time period, the Nareit All Equity REIT Index fell 6.06%.³⁷ NEPC observes that public market returns tend to lead private markets, but with larger swings and more volatility; as such, a single quarter may not be indicative of how private values will shift.
- For the one-year period ending September 30, 2026, the ODCE generated positive 1.31% gross
appreciation and a 4.60% total net return.³⁸ - Non-core North American real estate has posted a rolling one-year positive return of 0.70%,³⁹
continuing its moderately positive climb after nearly three years of negative trailing returns.
 Fundraising40
 Fundraising40
- Real estate fundraising in 2025 increased modestly relative to 2024, though each of the last two years remains lower than any other individual year in the prior decade. Data from the first quarter of 2026 does not show a reversal of the overall slowdown in real estate fundraising.
- Large-cap managers are still dominating fundraising, as the number of funds in the market continues to fall.
- Non-core North American funds raised the bulk of the capital in the first quarter, though overall contributions were limited across the board.
- NEPC observes that overall commitment volumes continue to be hampered by the slow return of capital from older vintage funds.
 Deal Activity41
 Deal Activity41
- Deal count through the first half of the year is on pace to be lower than in 2025; however, the volume of overall capital invested is on pace to be similar.
- This trend indicates that deal sizes have continued to increase, consistent with the theme of the consolidation of capital within larger funds and managers.
 Valuations42
 Valuations42
- Transaction cap rates have remained generally stable over the past few quarters, with apartment and office cap rates tightening by seven and 12 basis points quarter-over-quarter, respectively, and retail and industrial cap rates expanding by 11 and three basis points, respectively.
- Office cap rates remain the highest on a relative basis as the sector continues to experience challenges with occupancy and long-term fundamentals. Despite this, high-quality office real estate in high-quality markets has generally performed well. Industrial cap rates remain the lowest, as properties are generally liquid and are supported by strong leasing activity and rent growth projections.
There may be further downward valuation adjustments to come in future quarters, given the recent increases in the 10-year Treasury yield, and a persistent appraisal-valuation gap, particularly in apartments, and also within other property sectors.
Exits43
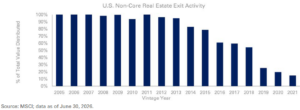
- Closed-end real estate funds showed little change in distributions in the second quarter. Aggregate DPI remains below 1.0x for all vintages since 2016, while MSCI data shows that even certain topquartile funds from 2019 and later vintages have produced DPI of approximately 0.5x or less, underscoring the lack of meaningful distributions from funds that invested at or near peak valuations.
- Potential near-term downward pressure on valuations, coupled with strong property-level and demographic-driven fundamentals across most sectors, may prolong the trend of slower exits as owners remain reluctant to sell. However, increased secondary activity observed in the market could create exit opportunities for asset owners.
33 PitchBook Record Redemptions, October 2026
34 PitchBook 3Q26 US Private Credit & Middle Market Quarterly Wrap
35 PitchBook 3Q26 US Private Credit & Middle Market Quarterly Wrap
36 PitchBook 3Q26 US Private Credit & Middle Market Quarterly Wrap
37 https://www.reit.com/news/blog/market-commentary/reits-broader-equities-fell-september-amid-bond-yield-monetary-policy
38 NCREIF as of September 30, 2026 (returns for Q3 are preliminary).
39 MSCI as of June 30, 2026.
40PitchBook as of June 30, 2026.
41PitchBook as of June 30, 2026.
42 NCREIF as of June 30, 2026.
43 MSCI as of June 30, 2026.
Real Assets
Real assets represent a broad array of underlying asset classes and sectors, including hard assets, for instance, infrastructure, and natural resources such as energy private equity. Real assets exhibit differentiated returns relative to other asset classes, offering potential diversification benefits for investors. Many real asset investments include a current income component, the potential for capital appreciation, and a partial hedge against inflation. In recent years, infrastructure has received a lot of attention from investors, resulting in the rapid growth and evolution of the infrastructure investment landscape.
Market Anecdotes
- Concentration among capital raising continues to be a major theme within infrastructure fundraising and deployment. 17 funds held final closes in the third quarter, but just three of those managers, KKR, Partners Group, and ECP, accounted for nearly 65% of the total capital raised.⁴⁴
- In July, Macquarie closed the sale Aligned Data Centers to a consortium of AIP, MGX, and Blackrock for an enterprise value of roughly $40 billion in what is the largest data center exit seen to date.⁴⁵ Data centers have been at the forefront of DPI and exit concerns, as these platforms have grown large enough to limit the natural buyer universe. This transaction provides some reassurance that well-run platforms can still realize value for investors.
- GE Vernova’s gas turbine backlog and slot reservations reached 116 GW in the second quarter, up from 83 GW at the end of 2025, against annual production of roughly 20 GW. The company is now taking orders for 2031 delivery, and first-half of 2026 orders were priced more than 20% above those from the fourth quarter of 2025.⁴⁶ With new gas generation capacity effectively five years away, existing power assets continue to command higher valuations as buyers pay a premium for existing capacity rather than wait years for new facilities to be built.
- Brent crude began the third quarter at $72 per barrel, its lowest level since the start of the Iran war in February. Renewed conflict and supply disruptions in Saudi Arabia subsequently pushed front-month futures to a peak of $109 on September 15, while spot cargoes traded as high as $132.⁴⁷ U.S. refineries ran at 95% utilization through the quarter, processing the most crude oil of any third quarter since 2019.
Performance
- Private natural resources extended their recovery in the second quarter, with rolling one-year returns climbing to roughly 12%, and overtaking infrastructure as the war with Iran drove repeated supply shocks in energy markets. Infrastructure eased to around 7% but remained the steadier of the two, consistent with its much narrower range of outcomes over the past 15 years.⁴⁸
- Infrastructure has delivered positive rolling one-year returns in almost every quarter since 2010, dipping only briefly below zero during the 2020 pandemic shock. Natural resources fell roughly 17% during the 2015–16 oil collapse and around 27% in 2020. Through both of those drawdowns, infrastructure returns remained in the single digits or did better.
 Fundraising
 Fundraising
- Following a record year for infrastructure and real asset fundraising in 2025, the second quarter of 2026 represented a continued pullback in capital raising. Despite a meaningful increase in capital raised from the first quarter, current levels are just about 19% of total 2025 levels.⁴⁹
- Sector-specific fundraising remains concentrated in renewables, and power and transmission, which together account for 81% of funds in the first half of 2026, despite renewables declining from 80% in 2025 to 58% as power and transmission increased to 23%.⁵⁰
- In line with recent years, the number of funds in the market has decreased despite fundraising continuing to trend upward over longer time periods, consistent with the broader theme of capital consolidating around large-cap managers.
 Deal Activity51
 Deal Activity51
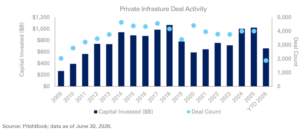
- Deal activity in 2026 has continued to trend broadly in line with 2024 and 2025, with capital invested and deal count tracking at similar levels on a year-to-date basis.
- Average deal size has increased as fundraising has become increasingly concentrated among large-cap managers. While the number of transactions has declined over the past five years, total capital deployed continued to rise, reflecting a shift toward fewer but larger deals.
- In April 2026, Stonepeak and Bernhard Capital Partners announced the acquisition of Cleco Group from a consortium of investors at a reported value of roughly $5.75 billion to $6 billion. The deal is underpinned by regulated rate base growth against accelerating demand, with U.S. regulated utilities experiencing rising load from data centers, industrial reshoring, and electrification.⁵²

Valuations
- Average U.S. gas generation valuations have exceeded $1,100/kW in 2026, more than double the average from 2020 to 2024, with recent large transactions establishing a roughly $1,000/kW floor for high-quality thermal assets. Tight supply and demand dynamics continue to drive investment appetite, and assets tied to energy transition or data centers have commanded premium valuations.⁵³
- NEPC observes that the power sector continues to attract investment capital, supported by rising demand for electricity. Capital formation has followed, with a growing number of managers raising vehicles targeting this space. This has caused some to express concern over valuations should competition for deals increase.
Exits
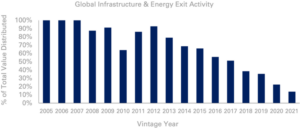
- Infrastructure secondaries volume reached $10 billion in the first half of 2026, and infrastructure rose to 14% of GP-led volume from 12% in 2025. Campbell Lutyens identifies infrastructure as one of the highest-priced segments of the secondary market over the period, consistent with secondaries serving as an access channel for quality assets rather than an outlet for distressed liquidity.⁵⁴
- While infrastructure performance remains steady relative to other parts of the private markets landscape that have experienced increased volatility, the infrastructure universe has also seen the growing trend of continuation vehicles, extended fund lives, and slowed distributions.
Source: MSCI; data as of June 30, 2026.
For questions on your private markets portfolio, or to discuss current market trends and opportunities, please reach out to your NEPC consultant.
44 https://ionanalytics.com/insights/infralogic/global-fundraising-report-3q26-mega-fund-closes-driving-volumes
45 https://aligneddc.com/press-release/aip-mgx-and-blackrocks-gip-close-acquisition-of-aligned-data-centers/
46 https://www.utilitydive.com/news/ge-vernova-gas-turbine-backlog-climbs-to-116-gw/826039/
47 https://www.eia.gov/TodayinEnergy/detail.php?id=68245
48 MSCI, as of 6/30/26
49 Pitchbook as of June 30, 2026.
50 https://media.infrastructureinvestor.com/uploads/2026/07/h1-2026-fundraising-report-infrastructure-investor.pdf
51 Pitchbook as of June 30, 2026.
52 https://www.iposcoop.com/the-ipo-buzz-csquare-csqr-prices-ipo-at-21-2-below-range
53 https://cdn.hl.com/pdf/2026/pur-group-thermal-and-renewable-markets-q2-2026-update.pdf
54 https://campbell-lutyens.com/media/keapzv55/campbell-lutyens-1h-2026-secondary-market-full-report_august-2026.pdf
For questions on your private markets portfolio, or to discuss current market trends and opportunities, please reach out to your NEPC consultant.