Introduction
Private market investments are making up an increasingly larger share of institutional and individual portfolios. Private market investments can generate a return premium to public markets but require tradeoffs in liquidity, fees, and complexity. In this quarterly report, NEPC’s investment team outlines our views on private markets. As always, we remain committed to helping our clients successfully run private market investment programs in the face of uncertainty and change.
Private markets strategies today exhibit many common themes:
- Liquidity: As discussed in the following sections, exit activity moderated in the first quarter of 2026 following an unusually strong fourth quarter of 2025. Continuation vehicles (including second generation continuation vehicles) and secondary sales served as key liquidity levers for general partners (GPs). As shown in the exit sections below, IPO markets remain largely closed for private equity backed assets and continue to contribute minimally to overall liquidity.Secondary sales have become increasingly common for limited partners (LPs), serving as largely destigmatized, tools for portfolio management. As the commitment‑pacing and planning season begins, many LPs are reassessing the relevance of historical assumptions around growth rates and fund lives across private market strategies.
- Flight-to-quality: In NEPC’s view, activity across fundraising, deal making, and exits is increasingly concentrated among larger GPs and bigger transactions across private equity, private debt, and real assets. We believe this dynamic reflects an ongoing preference for perceived quality, which has made the upper end of the market more competitive. At the same time, NEPC sees more compelling relative opportunities in smaller funds and transactions across credit, equity, and real assets, where competition appears less intense.
- Artificial intelligence: In NEPC’s view, this investment theme is becoming increasingly embedded across private market strategies, spanning venture capital, buyouts, real estate, and infrastructure. We believe AI-related valuations continue to rise, and as a result, we are taking a disciplined approach to distinguish high-quality investments from those that appear driven more by broader market enthusiasm.
- Rise of wealth: Individual investors are increasingly seeking exposure to private markets in their portfolios via rapidly expanding semi-liquid vehicles. Morningstar issued its inaugural ratings of semi-liquid funds in September 2025, further cementing the theme of public and private market convergence.1 PE evergreen assets in the U.S. reached $57.6 billion in 2025, more than doubling since 2022, including $13.8 billion of net inflows in 2025. Net assets across PE interval and tender offer funds exceeded $57 billion in the first quarter of 2026, highlighting continued growth in semiliquid and evergreen PE vehicles.2
- Industry consolidation: Industry consolidation: In NEPC’s view, ongoing consolidation is indicative of a maturing private markets landscape. We believe many of these transactions are being framed around themes such as democratizing access to private markets, enhancing valuation multiples through expanded alternatives offerings, or providing liquidity to GPs for succession planning and growth. In our perspective, recent examples, including Goldman Sachs’ acquisition of Industry Ventures and BlackRock’s acquisitions of Global Infrastructure Partners and HPS Private Credit, reflect these broader trends.
1 https://newsroom.morningstar.com/newsroom/news-archive/press-release-details/2025/Morningstar-Publishes-First-Medalist-Ratings-for-Semiliquid-Funds/default.aspx)
2 PitchBook Q1 2026 US PE Breakdown
Buyouts
Buyouts continue to play a core role in many private markets portfolios. In the first quarter, investor risk repricing accelerated amid geopolitical uncertainty, rising concerns around a recession, increasing focus on AI driven disruption, and reduced expectations for near term rate cuts. Public market investors increasingly emphasized hard, long duration assets with limited technological obsolescence, often referred to as “HALO” sectors.
Historically, these sectors represented roughly 10%–15% of private equity deal activity and about 14% of capital deployed from 2016 to 2024; however, in the first quarter of 2026, HALO aligned sectors accounted for just over 30% of private equity capital deployed, driven largely by a handful of large take private transactions, including the acquisition of AES.3 The increased allocation to hard asset businesses aligns with the preference of investors for inflation resilience, infrastructure exposure, and business models perceived to be less vulnerable to AI disruption.
NEPC’s buyout team remains focused on the lower end of the market, where we believe operational growth opportunities and a broader range of exit paths can support more favorable risk adjusted outcomes. Within this segment, the buyout team has highlighted managers focused on industrial and infrastructure services as relatively resilient given their mission critical nature and limited exposure to technological displacement. That said, periods of elevated uncertainty can also result in selective opportunities to deploy capital at more attractive entry points which may create a compelling opportunity for software investors especially via take-private transactions.
Market Anecdotes
- Jetro Restaurant Depot: In March of 2026, Leonard Green & Partners announced that Sysco has agreed to acquire Jetro Restaurant Depot from its multi-asset continuation fund at a valuation of roughly 14.6x operating income. The transaction marks one of the largest private equity backed exits on record and serves as an example of a successful continuation vehicle realization.4
- Medallia: In April of 2026, Thoma Bravo announced that it is nearing an agreement to hand over Medallia to its creditors after months of restructuring talks, a move that would wipe out roughly $5.1 billion of equity from Thoma Bravo and its co investors following the firm’s $6.4 billion buyout of the customer experience software company in 2021. Medallia has struggled under approximately $3 billion of debt, as rising rates and investor concerns around software valuations and AI disruption pressured performance, leaving lenders such as Blackstone, KKR, Apollo and Antares positioned to take control.5
- Clear Channel Outdoor Holdings: In February of 2026, Mubadala Capital, alongside TWG Global, agreed to acquire Clear Channel Outdoor Holdings in an all-cash transaction valuing the company at $6.2 billion. The deal exemplifies the HALO investing trend, reflecting investor preference for large, asset heavy, cash generative platforms like out of home advertising that are viewed as more defensively positioned amid AI driven disruption than digital or software centric business models.6
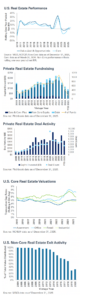
Performance
- Performance has remained relatively flat since markets recovered from their 2022 lows.
- The lack of distributions points to the fact that most of the performance is attributable to unrealized (paper) gains rather than realized capital gains returned to LPs.
Fundraising7
- Fundraising conditions remain constrained through the first quarter of 2026 with U.S. PE fundraising recording 84 final closes through the three months ended March 31, totaling $54.2 billion, consistent with expectations for another subdued year of capital formation.
- The primary constraint on LP recommitment capacity remains limited distributions. From 2022–2025, annual distributions averaged 16% of NAV, down from a historical average of roughly 25%, materially reducing LPs’ ability to recycle capital.
- Capital concentration trends observed in 2025 have persisted in 2026, with LP commitments consolidating around fewer, larger managers. Larger funds continue to dominate fundraising: the 10 largest funds accounted for $34.5 billion, or 63.7% of capital raised through the first quarter.
Deal Activity8
- The first quarter of 2026 marked the second lowest quarter in buyout platform deal activity by count over the last 10 years, with the first quarter of 2020 being the only quarter with less activity. Deal value was down from 2025 levels as well, but not as meaningfully.
- IT deals compressed this quarter, dropping from 31% of total deal value in the fourth quarter of 2025 to 17% driven by general market AI fears, drop in valuations of public software companies, and stressed credit markets.
- Healthcare and consumer deals were also down this quarter and contributed to the decline in deal activity, while deals within the energy sector experienced record quarter levels, illustrating the shift from software to HALO investments.
- There were 314 platform investments and 1,010 add-on acquisitions completed in the first quarter of 2026 compared to 461 and 1,297 completed a year earlier.
Valuations9
- Global and U.S. buyout valuation multiples entered 2026 at relatively stable levels, with trailing 12 month EV/EBITDA multiples near the recovery levels observed in 2024 and the plateau reached in 2025.
- Deal flow has remained skewed toward higher quality assets, potentially masking underlying valuation pressure.
- Since 2020, median U.S. buyout valuation multiples have reset higher, averaging approximately 13.0x EV/EBITDA compared with 10.8x from 2016 to 2020.
- With limited expectations for meaningfully lower borrowing costs or higher leverage, forward returns are expected to rely more heavily on operational value creation rather than multiple expansion.
Exits10
- U.S. private equity exit activity moderated in the first quarter of 2026 following an unusually strong fourth quarter. Estimated exits totaled 373 transactions and $144.4 billion in value, representing quarterly declines of 32.7% in volume and 16.7% in value. Importantly, exit levels were comparable to the second quarter of 2025 and remained above pre pandemic averages, with exit counts approximately 7.3% above historical normal levels.
- Despite mega-exits of transactions $1 billion or greater being down 50% quarter-over-quarter, exit value remained heavily concentrated in large transactions: exits of $1 billion or greater accounted for roughly 70% of total exit value.
- The U.S. PE backed company inventory grew to 13,325 companies, representing an estimated 8.7 year inventory at the current exit pace.
- Continued macro uncertainty suggests sponsors may rely more heavily on liquidity solutions, including continuation vehicles, rather than traditional exits.
- Exits to financial sponsors made up the majority of exits this quarter, by count, while exits via strategic corporate acquisitions comprised 58% of deal volume by dollars. This trend suggests that corporate buyers may be willing to pay higher prices for high-quality assets in the name of consolidation.
- IPO markets remain largely closed for PE-backed assets, contributing minimally to liquidity with only five IPOs closing this quarter, although each was valued at over $1 billion.
- A growing subset of sponsors are pursuing repeat continuation vehicles for the same assets, increasing LP scrutiny and raising questions around ultimate realizations. PitchBook tracked 38 continuation fund exits totaling $10.8 billion in the first quarter of 2026, similar in pace to a year earlier.
3 Source: PitchBook, US Private Equity Outlook, data as of March 31, 2026.
4 https://www.leonardgreen.com/sysco-to-acquire-jetro-restaurant-depot-to-expand-into-higher-margin-growing-and-resilient-cash-carrychannel/
5 https://www.reuters.com/business/thoma-bravo-nears-agreement-turn-software-firm-medallia-over-creditors-source-2026-04-22/
6 https://www.prnewswire.com/news-releases/clear-channel-outdoor-holdings-inc-agrees-to-be-acquired-by-mubadala-capital-in-partnership-
with-twg-global-for-6-2-billion-302683053.html
7 Source: PitchBook data as of March 31, 2026, unless otherwise stated.
8 Source: PitchBook data as of March 31, 2026, unless otherwise stated.
9 Source: PitchBook data as of March 31, 2026, unless otherwise stated.
10 Source: PitchBook data as of March 31, 2026, unless otherwise stated.
Venture Capital
Venture capital can provide return enhancement to investment programs, but in our experience, manager selection is paramount. The IPO market is poised for a meaningful reopening, catalyzed by a wave of highly anticipated mega-listings later this year (barring any unforeseen economic disruptions), which collectively could unlock trillions in exit value and accelerate broader IPO activity. These landmark offerings are expected to generate substantial liquidity and drive a meaningful increase in distributions over the course of 2026. That said, exits have been highly concentrated to date, with exit value in the first quarter reaching a record $347.3 billion; still, 72% of the quarter’s exit value has been driven by SpaceX’s acquisition of xAI.11 It is also important to note that this potential near-term increase in liquidity is highly concentrated, as the majority of exit activity will be driven by a small number of assets, meaning liquidity benefits are largely limited to venture funds with exposure to those specific companies.
Fundraising activity has surged but is heavily concentrated in the largest six managers. Moreover, deal value of $267.2 billion in the first quarter exceeds every full-year total except for 2021 and 2025, though activity remains heavily concentrated among the top five deals.11 AI has dominated the narrative across the industry, with many managers crowding this space to gain exposure; AI- and machine-learning focused companies received 89% of total VC dollars in the first quarter.11 We anticipate that valuations for non-AI companies with weaker earnings will begin to come under pressure, which may result in performance degradation among lower-quality firms and a wider dispersion of returns.
Market Anecdotes
- An all-stock transaction combining xAI with SpaceX valuing the deal at roughly $250 billion was announced in February 2026, which would rank among the largest corporate mergers ever reported. The transaction represents an internal consolidation of businesses controlled by Elon Musk rather than a conventional third-party acquisition, aimed at integrating AI development directly with SpaceX’s launch, satellite, and data infrastructure.12
- In February of 2026 Anthropic raised $30 billion in a Series G financing at a $380 billion post money valuation, one of the largest private venture rounds on record, led by GIC and Coatue with participation from a broad group of global institutional investors. The capital will support continued investment in frontier model development and largescale compute infrastructure, reinforcing Anthropic’s position as a leading enterprise focused AI platform amid intensifying competition at the top of the AI market.13
- OpenAI announced in March of 2026 a $122 billion funding round at an $852 billion post-money valuation, positioning the company to materially scale compute infrastructure and accelerate deployment of its frontier AI models across consumer, developer, and enterprise use cases. The round was backed by strategic and financial investors including Amazon, NVIDIA, SoftBank, and Microsoft, underscoring conviction that AI is evolving into core global infrastructure.14
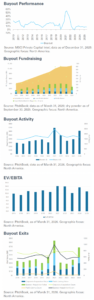
Performance
- Performance continues to strengthen after bottoming out in 2022. AI companies remain key drivers of performance.
- The venture investment landscape is becoming increasingly defined by concentrated capital flows and unrealized gains rather than liquidity events. The lack of distributions underscores the fact that most of the performance is attributable to unrealized (paper) gains rather than realized capital gains returned to LPs. Until exit markets reopen, the sector is likely to remain fueled by conviction and paper performance rather than realized returns.
Fundraising15
- Venture fundraising showed early signs of stabilization, with $47.8 billion raised across 172 funds in the first quarter of 2026. Relative to the $66.7 billion raised in all of 2025, the quarterly pace suggests improving momentum.
- Capital formation remained highly concentrated, as six large managers raised $36.4 billion, or roughly three-fourth of total capital. This underscores a continued bifurcation between scaled platforms and smaller managers in the current environment.
- Mega fund formation accelerated, with more $1+ billion venture funds closing in the first quarter than in all of 2025, signaling renewed investor support for established franchises.
- Smaller and emerging managers continue to face meaningful challenges, as public equity market volatility has constrained LP flexibility and disproportionately weighed on managers with less established platforms.
Deal Activity16
- VC activity was exceptionally large but highly concentrated. VC deal value in the first quarter reached $267.2 billion, surpassing all fullyear totals except 2021 and 2025; excluding the five largest transactions, deal value declined more than 70%, highlighting significant market concentration.
- Megadeals drove headline growth. Four VC transactions above $15 billion closed during the quarter, including OpenAI’s $122 billion raise, underscoring investor focus on a small number of “consensus” opportunities.
- AI continues to dominate venture investment. AI startups represented 42.5% of total deal count and over half of megadeals in the first quarter, a sharp increase from roughly 15% a decade ago.
- Leading platforms are leaning into early stage volume. Large VC firms materially increased seed and early stage activity, prioritizing speed, scale, and early ownership amid extended realization timelines.
Valuations17
- Valuation pressure continues to build across venture. Median pre money valuations have more than doubled since 2021 at the seed stage and increased meaningfully across all later stages, pointing to a sustained repricing of private growth assets.
- Deal sizes and valuations are rising at every stage. Series A median pre money valuations reached $62 million, while Series C medians approached $580 million, with half of all early stage rounds now exceeding $10 million.
- The market remains increasingly bifurcated. Average deal sizes materially exceed medians, reflecting a concentration of capital in a small number of large transactions that continue to skew aggregate metrics upward.
- Even as exit activity remains muted, the overall value of private venture assets continues to expand. Aggregate post money valuations of global unicorns now exceed $5.8 trillion, indicating that higher valuation levels may be becoming a more persistent characteristic of the private market environment.
Exits18
- Exit value rebounded sharply in the first quarter but was driven by a single transaction. Exit value in the first quarter reached a record $347.3 billion, though 72% was attributable to SpaceX’s consolidation-related acquisition of xAI rather than a traditional third party exit.
- Underlying exit activity has improved but remains concentrated. Excluding the xAI transaction, exit value totaled $97.3 billion—the strongest quarter since the fourth quarter of 2021—suggesting incremental progress off cycle lows.
- Liquidity remains limited despite headline strength. Nearly 87% of acquisitions disclosed no valuation, pointing to continued valuation pressure and modest realizations, though even discounted liquidity is viewed as constructive given prolonged exit stagnation.
- IPO activity is gradually re emerging, with key tests ahead. Fifteen VC backed IPOs priced in the first quarter (40% in biotech/pharma), and anticipated listings from large platforms such as SpaceX, OpenAI, and Anthropic are viewed as pivotal for shaping broader exit conditions—
either catalyzing issuance or absorbing market capacity.
11 Source PitchBook data as of March 31, 2026
12 https://www.bbc.com/news/articles/cq6vnrye06po
13 https://www.anthropic.com/news/anthropic-raises-30-billion-series-g-funding-380-billion-post-money-valuation
14 https://openai.com/index/accelerating-the-next-phase-ai/
15 Source: PitchBook data as of December 31, 2025 unless otherwise stated.
16 Source: PitchBook data as of March 31, 2026, unless otherwise stated.
17 Source: PitchBook data as of March 31, 2026, unless otherwise stated.
18 Source: PitchBook data as of March 31, 2026 unless otherwise stated.
Private Credit
We’ve seen private credit strategies gain prominence over the last decade as banks and other financial institutions have scaled back their lending activity. Many institutional investors have significant allocations to private credit, taking advantage of higher yields and total returns, enjoying a premium to public markets and flexibility around portfolio construction with shorter fund lives than private equity. Private credit is more than just direct lending; other investment strategies include opportunistic/transitional capital, junior debt, and strategies focused on collateral outside of corporate credit, including asset based lending. Borrowers include private companies and private equity sponsored companies, and the demand for capital continues to grow. As long-standing private credit investors, NEPC is focused on the themes below.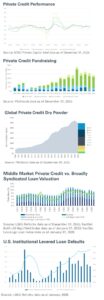
Market Anecdotes19
- BDCs (Business Development Companies) were in the headlines this quarter: Blue Owl’s OBDC II (a private, non traded BDC) experienced liquidity pressure following a failed merger with the firm’s publicly traded BDC. The transaction collapsed after news of the proposed merger leaked, and investors rushed to put in their redemption notices – creating technical pressure on the vehicle’s NAV. In response, Blue Owl pivoted to a secondary sale of assets to provide liquidity back to investors and eventually wound down the vehicle, selling approximately 34% of the OBDC II portfolio (along with assets from several other Blue Owl vehicles) at a purchase price of 99.7%. The near-par purchase price underscores the depth of demand for seasoned private credit assets in the secondary market. The buyers of this specific portfolio were primarily pension funds and insurance companies.
- GP-led secondaries are being used proactively to manage redemptions.19 According to PitchBook’s quarterly wrap for the first quarter, Cliffwater has been quoted in the market as looking to sell about $1 billion of its CCLFX NAV (retaining $9 billion of exposure). This is on the back of investor redemption requests of 13.9% of shares outstanding in the first quarter of 2026.17 The use of GPled secondaries as a portfolio management tool is relatively new to the private credit market but being adopted by BDCs and evergreen funds.
- According to PitchBook LCD’s first quarter survey, 35% of respondents cite negative perception as the primary near-term headwind for private credit.19 Recent headlines pertaining to topics such as redemptions from semi-liquid vehicles, potential AI disruption, amongst other considerations, are more nuanced than they appear and may have varying degrees of impact on the private debt asset class.
- According to PitchBook LCD’s first quarter survey, investors expect spreads across middle-market private credit loans to widen quarter-over-quarter – driven by technicals.
- Software exposure remains a key focus for investors, as AI disruption and declining valuations weighed on parts of the technology sector this quarter. As one of the largest segments in private credit (~20% by count and volume), rising stress is notable with non-performing loans increasing to ~4% to 5%, above the historical ~2%. NEPC expects dispersion in performance to widen over time in this part of the market.
Performance20
- Base rates for floating-rate loans are tied to the secured overnight financing rate (SOFR), which stands at 3.50%–3.75% on the heels of the March 18, 2026, Federal Open Market Committee decision to keep its policy interest rate unchanged. Floating rate loans include first lien, uni-tranche and broadly syndicated loans (BSLs).
- Average all-in yields for middle-market direct lending deals (including first-lien and unitranche)were flat at 9.13% in the first quarter (vs. 9.16% in the fourth quarter).
- The yield premium for direct lending deals compared to broadly syndicated middle-market loans widened to 228 basis points in the first quarter.
- Average spreads on first-lien middle-market direct lending were modestly tighter quarter-overquarter at 498 basis points in the first quarter.
- BSL spreads were modestly tighter quarter-over-quarter at 376 basis points in the first quarter.
Fundraising19 & 21
- Private credit fundraising in 2025 remained resilient in terms of the capital raised, despite the broader slowdown across private markets.
- As of December 31, 2025, 206 traditional drawdown private debt funds held their final close in 2025, raising $221.2 billion in aggregate, per PitchBook data.
- Capital raised was modestly flat year-over-year at $221.2 billion in 2025 versus $240 billion in 2024.
- Fund count was down year-over-year at 206 in 2025 versus 316 in 2024.
- Interval funds, tender offer funds, and BDCs also experienced notable net inflows of retail capital as well as institutional and insurance capital. These inflows are not captured in the 206 funds and $221.2 billion raised through December 31, 2025 statistics. That said, these inflows have been somewhat offset by considerable redemption requests in the first quarter of 2026.
- As of December 31, 2025, 206 traditional drawdown private debt funds held their final close in 2025, raising $221.2 billion in aggregate, per PitchBook data.
Deal Activity20 & 22
- Sponsored direct lending deal flow came in at $26 billion in the first quarter, down 29% from the prior quarter.
- Middle market LBO lending was down by nearly 50% quarter-over-quarter
- According to LSEG LPC’s Lender Outlook Survey, in the first quarter, the highest share of respondents (50%) reported average deal quality. That said, 40% report below-average quality and this is a notable increase from the ~20% reported in the fourth quarter. That said, respondents also reported the performance of existing portfolio exposure is primarily tracking in line (56%) or above plan (27%).
Valuations20
- According to LSEG LPC, leverage levels across the direct lending market were relatively flat quarterover- quarter.
- For companies generating more than $40 million in EBITDA, average leverage levels were 5.66x in the first quarter (up from 5.42x in the fourth quarter).
- That said, this is a significant increase relative to the total 2025 level (4.88x).
- For companies generating between $40 million to $20 million in EBITDA (lower middle market), average leverage levels were 4.56x in the first quarter (down from 4.72x in the fourth quarter).
- For companies generating more than $40 million in EBITDA, average leverage levels were 5.66x in the first quarter (up from 5.42x in the fourth quarter).
- Middle-market LBO purchase price multiples rose modestly from 11.34x in the fourth quarter to 11.94x in the first quarter.
- Large-cap LBO purchase price multiples declined sharply from 14.93x in the fourth quarter to 9.97x in the first quarter.20 Large-cap defined by LSEG as companies generating more than $500 million in revenue.
Exits23 & 24
- Closed-end direct lending funds saw little change in distribution amounts during the fourth quarter; aggregate distribution-to-paid-in (DPI) multiples were below 1.0x for 2018 and all subsequent vintage years. There is limited dispersion between quartiles.
- The TTM leveraged loan default rate rose to 5.2% in January 2026 from 4.8% in December 2025 (LSEG Refinitiv January 2026).
- The technology sector led in defaulted volume in the first quarter.
Disclosures: Direct lending data comprises PitchBook’s direct lending, general debt and bridge financing data. Opportunistic credit consists of PitchBook’s opportunistic credit and venture debt data.
19 PitchBook 1Q26 US Private Credit & Middle Market Quarterly Wrap
20 LSEG LPC Middle Market Connect: The Middle Market Opportunity (published April 2026). Data coverage first quarter 2026.
21 PitchBook 2025 Annual Global Private Debt Report; data as of December 31, 2025.
22 LSEG LPC’s 2Q26 Lender Outlook Survey
23 LSEG LPC Distressed Market Review (January 2026)
24 MSCI Private Intel data as of December 31, 2025
Real Estate
Private real estate can play multiple roles in a portfolio, ranging from more income-oriented core and core-plus strategies to total-return-seeking opportunistic approaches at the other end of the spectrum. In recent years, real estate has experienced swings in valuations driven by the rapid fall and rise in interest rates. As the market finds its footing, we observe general liquidity, but many real estate investors continue to hold out for more favorable pricing which has slowed distributions to investors.
Market Anecdotes25, 26, 27 & 28
- Real estate valuations, represented by transaction cap rates, continue to show signs of stability after years of uncertainty. Cap rates for apartment and industrial assets remain around 5%, and the rolling four-quarter average for retail continues to experience cap rate compression.
- The recovery in the office sector, meanwhile, remains slow and varied. T he fourth quarter transaction cap rate jumped back up to 7.7% at the end of 2025, a quarter after dropping to 6.33%, its lowest level in over two years. On a more positive note for the office sector, a CoStar report indicates that approximately 120 million square feet of leases were signed in the first quarter of 2026, representing a 25% increase over the first quarter of 2025 and the highest quarterly total since 2018.
- New construction continues to be slow across property sectors. According to Cushman & Wakefield, new apartment development has fallen to its lowest level since 2016 in the first quarter and new deliveries have declined roughly 30% year-over-year.27 Per JLL data, new industrial completions in 2026 are expected to be nearly 60% below their 2023 peak.
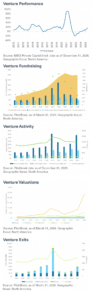
Performance31
- The recovery in core real estate, as represented by the NFI-ODCE Index, remains slow overall. However, the first quarter showed a modest improvement relative to the second half of 2025, with a 0.24% appreciation return following two consecutive quarters of negative appreciation. The total net return for the first quarter was 1.25%.
- For the one-year period ending March 31, 2026, the ODCE generated slightly negative (-0.10%) appreciation and a 3.11% total net return for the year.
- Core real estate appreciation remained flat through the end of 2025. Non-core real estate continued to move closer to a positive rolling one-year return, finishing 2025 at -0.11%, but has not yet posted a positive calendar-year result since the 2022 interest rate hikes triggered a sharp market correction.
Fundraising
- Real estate fundraising in 2025 increased modestly relative to 2024, though each of the last two years remain lower than any other individual year in the prior decade.
- Large-cap managers are still dominating fundraising, as the number of funds in the market continue to fall.
- Real estate debt strategies continued to attract capital in 2025, representing the single real estate sub-asset class where fundraising exceeded the average amount raised in the prior decade. Core and core-plus real estate continue to struggle to raise meaningful capital from investors.
- Overall commitment volumes continue to be hampered by a slow return of capital from older vintage funds.
Deal Activity
- There is liquidity in the market as acquisition activity from private funds continues to recover from cyclical lows experienced over the past two years.
- According to data from PitchBook, private real estate deal volumes (in dollar terms) are slightly below 2024, but exceed 2022, 2023, and prepandemic levels.
- Altus Group’s latest report on commercial real estate transactions indicates a recent uptick in transaction volume, with the highest dollar volume of trades since 2021 and 2022 highs. An increase in industrial trades is the largest driver of this growth, though office investment also shows a notable elevation over previous quarters.
- While deal count is lower than four of the previous five years, overall capital invested exceeds medium and long-term averages, indicating an increase in larger transaction sizes, consistent with the increased fundraising among large-cap funds observed (as noted above).
Valuations
- Transaction cap rates, or “going-in yields,” for apartments and industrial ticked up slightly, but remain stable at just above 5%.
- Spot cap rates for both retail and office properties spiked in the fourth quarter, with retail cap rates increasing by about 1% and office cap rates rising by nearly 1.5% relative to the third quarter. Despite this jump, the increase follows a full calendar year of cap rate compression across both sectors, leaving the rolling four-quarter average similar quarter-over-quarter.
Exits
- Closed-end real estate funds showed little change in distribution amounts during the third quarter. Aggregate distribution-to-paid-in (DPI) multiples below 1.0x for 2016 and all subsequent vintage years.
- Stabilizing property values and continued improvements in market liquidity should (hopefully) help support a healthier exit environment in 2026.
25 Source: NCREIF data as of December, 2025.
26 https://www.costargroup.com/press-room/2026/us-office-leasing-reaches-strongest-quarter-2018
27 https://www.cushmanwakefield.com/en/united-states/news/2026/04/us-apartment-market-turns-corner-as-new-supply-declines- sharply
28 https://www.jll.com/en-us/insights/market-outlook/global-real-estate
31 Source: MSCI data as of 12/31/25
Real Assets
Real assets represent a broad array of underlying asset classes and sectors, including hard assets, for instance, infrastructure, and natural resources such as energy private equity. Real assets exhibit differentiated returns relative to other asset classes, offering potential diversification benefits for investors. Many real asset investments include a current income component, the potential for capital appreciation, and a partial hedge against inflation. In recent years, infrastructure has received a lot of attention from investors, resulting in the rapid growth and evolution of the infrastructure investment landscape.
Market Anecdotes28, 29 & 30
- Infrastructure continues to attract substantial private capital, with nearly all of the capital focused on North America and Europe. As infrastructure allocations increase, some investors are also rethinking the purpose of the exposure. A McKinsey & Company survey highlights a growing emphasis on return-oriented strategies, rather than infrastructure being used solely for income and diversification.
- The existing energy and energy infrastructure crisis that has been bubbling under the surface for years is now beginning to reach mainstream ears based on recent current events. U.S. gas prices recently hit four-year highs as the Iran war shocks oil supplies, while an op-ed published in the New York Times recently called the situation a “wake-up” call for the aging U.S. electrical grid infrastructurel.
- While energy and energy infrastructure dominate current headlines, critical infrastructure needs span a wide range of sub-sectors globally. McKinsey & Company estimates that more than $100 trillion of infrastructure investment will be required by 2040 to support existing assets and meet future demand.
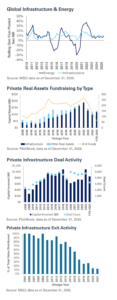
Performance31
- Both natural resources and infrastructure funds ended 2025 in the black, with natural resources just over 4% and global infrastructure posting a return of over 11% for the year.
- Infrastructure continues to demonstrate strong stability and performance, with only one negative rolling one-year period since the global financial crisis, ending in March 2020. In 2025, the asset class generated a double-digit return, notable for an allocation typically emphasized for income generation rather than absolute return potential.
- Natural resources also ended the year on a strong note, posting their best rolling one-year return in nearly two years. However, the asset class has exhibited materially less stability than infrastructure, with significantly wider swings in returns and more pronounced peaks and troughs over the past 15 years.
Fundraising
- Fundraising for infrastructure and energy private equity strategies was robust in the fourth quarter, making 2025 the strongest year on record for infrastructure fundraising, according to data from PitchBook.
- While energy fundraising is up overall since its COVID-era lows, the year-over-year fundraising growth in real assets has come from infrastructure, and energy and other real asset fundraising realized a slight decrease compared to 2024 data.
- Capital raising remains focused on North America and Europe, with just over 7% raised outside these two regions, according to data from PitchBook.
Deal Activity31
- In 2025, capital invested in real assets increased modestly from 2024, with the year ending at the highest annual investment volume on record, according to PitchBook data.
- While overall deal volume peaked, the same dataset showed a continuation of the long-term decline in individual deal count, reflecting an ongoing shift towards larger transactions as mega-funds seek opportunities to deploy capital.
- Notable transactions in the final quarter included the $3.45 billion disposition of Inkia America S.A.C. by I Squared Capital Advisors LLC. Inkia, a large Peruvian power provider, represents I Squared’s first continuation vehicle transaction. The firm sold a 50% interest to CPPIB and plans to form a continuation vehicle for the remaining stake. Continuation vehicles have emerged as an increasingly utilized tool among larger private investment managers facing limited liquidity options for mature investments.
Valuations32
- Valuation multiples (EV/ EBITDA) for infrastructure transactions are stable, according to a report published by DWS in January 2026. According to DWS’s data, multiples have risen slightly from mid-year through to the end of 2025.
- NEPC observes that digital infrastructure continues to attract investor capital, and the power sector has seen renewed interest, causing some to express concern over valuations should competition for deals increase.
Exits
- At a high level, infrastructure distributions remain unchanged quarter-over-quarter, though 10+ year old funds continue to see moderate improvement.
- While infrastructure performance remains steady relative to other parts of the private markets landscape that have experienced increased volatility, the infrastructure universe has also seen the growing trend of continuation vehicles, extended fund lives, and slowed distributions.
For questions on your private markets portfolio, or to discuss current market trends and opportunities, please reach out to your NEPC consultant.
28 https://www.mckinsey.com/industries/private-capital/our-insights/global-private-markets-report/infrastructure
29 https://www.reuters.com/business/us-pump-prices-near-4-year-high-iran-war-disruption-refinery-outages-2026-04-28/
30 https://www.nytimes.com/interactive/2026/04/27/opinion/electricity-power-grid-infrastructure.html?unlocked_article_code=1.eVA.K0jI.BjhMVPdISiFI&smid=url-share
31 Source: MSCI data as of 12/31/25
For questions on your private markets portfolio, or to discuss current market trends and opportunities, please reach out to your NEPC consultant.