Introduction
Private market investments are making up an increasingly larger share of institutional and individual portfolios. Private market investments can generate a return premium to public markets but require tradeoffs in liquidity, fees and complexity. In this quarterly report, NEPC’s investment team outlines our views on private markets. As always, we remain committed to helping our clients successfully run private market investment programs in the face of uncertainty and change.
Private markets strategies today exhibit many common themes:
- Liquidity: In NEPC’s view, exits picked up in the second quarter of 2026 because continuation vehicles (including second-generation continuation vehicles), secondary sales, and credit amendments and restructurings served as key liquidity levers for general partners (GPs). NEPC has observed, secondary sales have become increasingly common for limited partners (LPs), serving as largely destigmatized tools for portfolio management. Many LPs are reassessing the relevance of historical assumptions around growth rates and fund lives across private market strategies.
- Flight-to-quality: In NEPC’s view, activity across fundraising, deal-making and exits is increasingly concentrated among larger GPs and bigger transactions across private equity, private debt and real assets. We believe this dynamic reflects an ongoing preference for perceived quality, which has made the upper end of the market more competitive. At the same time, NEPC sees more compelling relative opportunities in smaller funds and transactions across credit, equity and real assets where competition appears less intense.
- Artificial intelligence: In NEPC’s view, this investment theme is becoming increasingly embedded across private market strategies, spanning venture capital, buyouts, real estate, and infrastructure. We believe AI-related valuations continue to rise, and as a result, we are taking a disciplined approach to distinguishing high-quality investments from those that appear driven more by broader market enthusiasm.
- Rise of wealth: Individual investors are increasingly seeking exposure to private markets in their portfolios via rapidly expanding semi-liquid vehicles. Morningstar issued its inaugural ratings of semi-liquid funds in September 2025, further cementing the theme of public and private market convergence1. Net assets across PE interval and tender offer funds exceeded $99 billion by the end of Q2 2026, highlighting continued growth in semiliquid and evergreen PE vehicles2.
- Industry consolidation: In NEPC’s view, ongoing consolidation underscores a maturing private markets landscape. We believe many of these transactions are being framed around themes such as democratizing access to private markets, enhancing valuation multiples through expanded alternatives offerings, or providing liquidity to GPs for succession planning and growth. In our perspective, recent examples, including Goldman Sachs’ acquisition of Industry Ventures and BlackRock’s acquisitions of Global Infrastructure Partners and HPS Private Credit, reflect these broader trends.
1 https://newsroom.morningstar.com/newsroom/news-archive/press-release-details/2025/Morningstar-Publishes-First-Medalist-Ratings-for-Semiliquid-Funds/default.aspx)
2 PitchBook Q2 2026 US PE Breakdown
Buyouts
Buyouts continue to play a core role in many private markets’ portfolios despite a more challenging market backdrop in 2026. Dealmaking slowed during the second quarter as higher financing costs, uncertainty around interest rates, and evolving views on the impact of artificial intelligence tempered market activity. While software investment activity declined significantly, hard, long-duration assets with limited technological obsolescence, often referred to as HALO sectors, remained comparatively resilient, supported by growing demand for power, data and other critical assets.
Liquidity remains the primary challenge facing the asset class. In the first half of 2026, exit activity improved only modestly and is concentrated among a limited number of larger transactions, resulting in muted distributions to investors and a fundraising environment that continues to favor larger, established managers2. Until realizations accelerate meaningfully, fundraising and deployment activities are likely to remain constrained.
NEPC’s buyout team still sees opportunity in the lower middle market, where value creation is often driven more by operational improvement than financial engineering. The team believes this segment benefits from a larger universe of potential acquirers and greater flexibility in exit planning, which can support attractive risk-adjusted returns across market cycles. In the current environment, NEPC remains particularly focused on managers investing in industrial and infrastructure services businesses, as these companies typically provide essential products and services, generate recurring demand, and face relatively limited risk from technological disruption.
Market Anecdotes
- In April 2026, KKR announced the final close of KKR North America Fund XIV (NAX4) at approximately $23 billion, making it the largest private equity fund raised exclusively for North American investments. The fund’s successful raise highlights the continued concentration of LP capital among a small group of scaled, established managers and underscores the growing consolidation of fundraising activity at the upper end of the private equity market3.
- Arxis, an aerospace and defense components manufacturer owned by Arcline Investment Management, began trading on the Nasdaq under the ticker ARXS on April 16, 2026. The offering of roughly 37.7 million shares, priced in a $25 to $28 range, raised about $1.06 billion at a valuation near $11 billion, making it one of the quarter’s largest private equity-backed listings4. ARXS ended the quarter at $46.14 per share5.
- The growth of continuation vehicles is attracting new participants from the traditional buyout market, with firms such as New Mountain6, H.I.G.7, and Leonard Green8 establishing dedicated GP-led secondary strategies. This trend reflects the increasing role of continuation funds as a permanent feature of the private equity liquidity toolkit rather than a niche solution used during periods of market disruption.

Performance
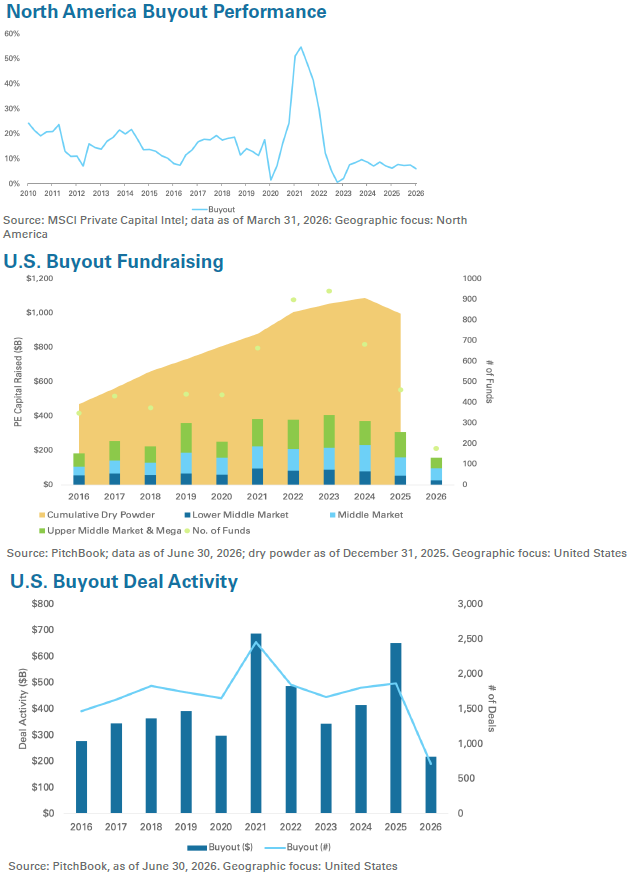
- Private equity performance has remained relatively stable since recovering from the 2022 market correction.
- Performance continues to be constrained by a slow realization environment, as sponsors face a challenging exit backdrop that includes limited distributions to investors and delays in the return of capital.
- Reported returns remain heavily influenced by unrealized valuation increases rather than realized gains, reflecting the limited volume of portfolio company sales and other liquidity events.
- Distribution activity remains below historical norms, resulting in a larger share of performance being derived.
Fundraising9
- Private equity fundraising remains subdued, with U.S. managers raising $159.6 billion across 178 funds through the first half of 2026. While capital raised is broadly consistent with 2025 levels, the number of successful fund closes continues to decline.
- Capital continues to concentrate among larger established managers. Experienced sponsors raised $139.3 billion year-to-date, nearly seven times the $20.3 billion raised by emerging managers, reflecting investors’ preference for scale and proven track records.
- The fundraising market increasingly favors either large flagship platforms or highly differentiated specialists. Funds under $1 billion captured just 16.7% of commitments, while evergreen and semi-liquid vehicles remained one of the fastest-growing segments of the market.
Deal Activity10
- U.S. buyout activity moderated during the first half of 2026, with reported deal value totaling $217.3 billion across 712 transactions, as sponsors remained selective amid market volatility and a more disciplined financing environment.
- Buy-and-build strategies continued to be a key source of activity, with add-on acquisitions accounting for 2,092 transactions and $141.6 billion of value, underscoring sponsors’ preference for driving growth through existing portfolio platforms.
- Large transactions continued to underpin market activity, with 50 deals valued above $1 billion contributing $173.1 billion of total deal value despite a broader slowdown in transaction volumes.
- Investment activity shifted across sectors, as software deal volume and value declined amid AI-driven disruption and valuation recalibration, while energy investment increased approximately 80% year-over-year as investors focused on power, infrastructure and other assets benefiting from rising demand for datacenters and electricity.
 Valuations11
 Valuations11
- Buyout valuations remain elevated despite slower transaction activity. Median U.S. buyout entry multiples were approximately 12.0x EV/EBITDA, hovering around peak levels and above historical averages.
- Transaction activity remains concentrated in higher-quality businesses, with average margins continuing to improve. This trend may be masking valuation pressure across lower-quality segments of the market.
Exits12
- Exit activity moderated during the first half of 2026, with reported exit value totaling $272.3 billion across 506 transactions. Realized liquidity remains below recent historical levels, exacerbating ongoing distribution challenges for investors.
- Large transactions valued above $1 billion continued to dominate the exit market despite a decline in overall deal volume.
- Public equity markets showed early signs of improvement, with IPO value increasing in the second quarter. However, the reopening remains selective and concentrated within a limited number of sectors and companies.
- The growing backlog of private equity-backed companies, combined with continued market uncertainty, is driving greater adoption of alternative liquidity solutions such as continuation vehicles while sponsors await more favorable exit conditions.
3 https://www.businesswire.com/news/home/20260402033814/en/KKR-Closes-%2423-Billion-North-America-Private-Equity-Fund
4 https://arcline.com/arcline-backed-arxis-announces-launch-of-its-initial-public-offering
5 https://finance.yahoo.com/quote/ARXS/history
6 https://finance.yahoo.com/markets/stocks/articles/mountain-wants-next-great-investment-201541416.html
7 https://pe-insights.com/h-i-g-capital-hires-morgan-stanley-secondaries-team-ahead-of-gp-led-fund-launch
8 https://www.prnewswire.com/news-releases/leonard-green–partners-announces-inaugural-sage-equity-investors-at-over-3-6-billion-of-commitments-302670129.html
9 Source: PitchBook as of June 30, 2026
10 Source: PitchBook as of June 30, 2026
11 Source: PitchBook as of June 30, 2026
12 Source: PitchBook as of June 30, 2026
Venture Capital
Venture capital can serve as an important tool to enhance returns within a diversified investment program; in our experience, manager selection remains the primary driver of outcomes. The asset class is entering an important transition period as the IPO market shows signs of reopening, which could improve liquidity conditions, increase distributions to investors, and support a broader recovery in exit activity. However, realizations remain concentrated among a relatively small group of highly sought-after companies as improvements in liquidity are not experienced evenly across the venture ecosystem.
Fundraising and investment activity have improved meaningfully although capital remains concentrated among the industry’s largest managers and a limited number of companies. Artificial intelligence remains the dominant area of investor focus, creating significant opportunities for managers with differentiated access and expertise, while also driving higher valuations and increased market concentration. Looking ahead, we expect return dispersion to widen as investors become more selective, rewarding category-leading businesses with strong fundamentals, while placing greater pressure on companies struggling to demonstrate sustainable growth, profitability, or strategic relevance in an increasingly AI-driven market.
Market Anecdotes
- SpaceX listed on the Nasdaq under the ticker SPCX on June 12, 2026, raising roughly $75 billion at a valuation near $1.75 trillion, the biggest initial public offering ever completed. First-day trading pushed its market value above $2 trillion. This single event drove exit values of venture public listings to $1.79 trillion for the first half of the year, accounting for the bulk of the record aggregate figure13.
- Anthropic raised $65 billion in Series H financing on May 28, 2026, at a $965 billion valuation14, overtaking OpenAI15, which reached roughly $852 billion after a large financing in late March. Both companies are laying groundwork for potential public listings. Rounds of this magnitude are the mechanical driver behind AI’s 86.0% share of first half of the year deal value16.
- AI infrastructure companies continued to attract significant interest from investors during the quarter, highlighted by Baseten’s $1.5 billion Series F financing at a $13 billion valuation and Groq’s $650 million funding round to support the expansion of its AI inference cloud and infrastructure platform17. These transactions underscore investors’ willingness to commit substantial capital to a small number of perceived category leaders.
 Performance
 Performance
- Venture performance has continued to recover from the 2022 downturn, supported primarily by appreciation in AI-related companies and a small group of highly valued private businesses.
- Returns remain heavily driven by unrealized gains rather than realized liquidity. While portfolio valuations have increased, distributions have remained limited as exit activity is yet to normalize across the broader market.
- Until exit markets broaden and liquidity improves, reported performance is likely to remain more dependent on private market valuations than realized cash returns to investors.
Fundraising18
- Venture fundraising totaled $72.4 billion across 405 funds during the first half of 2026, continuing the market’s normalization from the record fundraising environment of 2021 and 2022.
- Capital raising remains concentrated among the industry’s largest managers. Funds of $1 billion or more accounted for $49.5 billion of commitments across just 16 vehicles, highlighting investors’ continued preference for established platforms.
- Smaller and emerging managers continue to face a challenging fundraising environment. First-time funds raised only $3.4 billion across 53 vehicles, reflecting limited LP capacity and a continued flight toward scale and proven track records.
- Company formation remains healthy, but fund formation continues to contract. This divergence suggests capital is increasingly flowing to a smaller group of managers despite strong levels of entrepreneurial activity.
Deal Activity19
 Venture investment activity accelerated significantly in the first half of 2026, with deal value reaching $412.7 billion, already surpassing full-year 2025 levels by nearly 30%.
- Investment activity remains highly concentrated. Megadeals of $100 million or more represented 87.5% of capital deployed; smaller financings accounted for only 12.5% of total deal value.
- Artificial intelligence continues to dominate venture investing, attracting $355.9 billion, or approximately 86% of all capital invested during the period. AI companies now represent nearly half of the value of the U.S. venture ecosystem.
- Investor capital has increasingly focused on a small number of market leaders. Seven financings of $1 billion or more closed during the second quarter, including Anthropic’s $65 billion financing round, underscoring continued demand for a limited set of high-conviction opportunities.
 Venture investment activity accelerated significantly in the first half of 2026, with deal value reaching $412.7 billion, already surpassing full-year 2025 levels by nearly 30%.
Valuations20
- Venture valuations have not only recovered from the 2022-2023 correction but also have exceeded prior peak levels across most stages of the market. Median pre-money valuations are now materially higher than those observed during the 2021 cycle.
- Valuation expansion has been particularly pronounced among later-stage companies. The median Series D+ pre-money valuation reached approximately $2.0 billion during the first half of 2026.
- A growing valuation gap has emerged between AI-focused companies and the broader market. As companies mature, AI businesses continue to command substantially higher valuation multiples and financing terms than their non-AI peers.
Exits21
- Exit value reached a record $2.19 trillion in the first half of 2026, but the headline figure was heavily influenced by SpaceX’s approximately $1.7 trillion public listing and does not reflect a broad-based recovery in liquidity.
- Underlying exit activity remains relatively modest. Total exit count was approximately 755 transactions, demonstrating that record exit value has been driven by a limited number of exceptionally large events rather than widespread realizations across the asset class.
- M&A activity improved during the period, with acquisition value reaching approximately $375 billion, providing an additional source of liquidity in an otherwise constrained exit environment.
- The IPO market is showing signs of reopening, with several large venture-backed companies reportedly preparing to enter the public markets. However, a broader recovery in distributions depends on whether IPO activity expands beyond a small group of highly anticipated AI-related issuers.
13 https://www.nytimes.com/2026/06/12/technology/spacex-ipo-elon-musk.html
14 https://www.anthropic.com/news/series-h
15 https://openai.com/index/accelerating-the-next-phase-ai
16 PitchBook, as of June 30, 2026
17 https://news.crunchbase.com/venture/biggest-funding-rounds-ai-marketing-robotics-baseten
18 Source: PitchBook as of June 30, 2026
19 Source: PitchBook as of June 30, 2026
20 Source: PitchBook as of June 30, 2026
21 Source: PitchBook as of June 30, 2026
Private Credit
At NEPC, we have observed private credit strategies gain prominence over the last decade as banks and other financial institutions have scaled back their lending activity. Many institutional investors have significant allocations to private credit, taking advantage of higher yields and total returns, while enjoying a premium to public markets and flexibility around portfolio construction with shorter fund lives than private equity.
Private credit is more than just direct lending; other investment strategies include opportunistic/ transitional capital, junior debt, and strategies focused on collateral outside of corporate credit, including asset-based lending. Borrowers include private companies and private equity sponsored companies, and the demand for capital continues to grow. As long-standing private credit investors, NEPC is focused on the following themes:
Market Anecdotes
- BDCs (Business Development Companies) continue to face redemption activity. BCRED redemption demand increased from 7% in the first quarter to 10% in the second quarter of 2026. During this same period, Apollo Debt Solutions saw requests increase from 11% to 17%. Cliffwater CCLFX saw requests increase from 14% in the first quarter to 17% in the second quarter of 202622. That said, redemption caps are being enforced broadly and institutional demand for perpetual vehicles remains strong. Some managers have stated that redemptions have been driven by a small number of large investors, including a few notable non-U.S. investors.
- The private credit secondaries market continues to grow. A continuation vehicle that transacted this quarter was led by Ares and involved a $1.7 billion Antares Capital portfolio22. Direct lending deal volumes fell in the second quarter. PitchBook LCD recorded $33 billion across 149 transactions in the second quarter, versus $74.1 billion across 217 transactions in the prior quarter. That said, more than half of LCD survey respondents indicated their optimism around deal flow picking up over the next 90 days22.
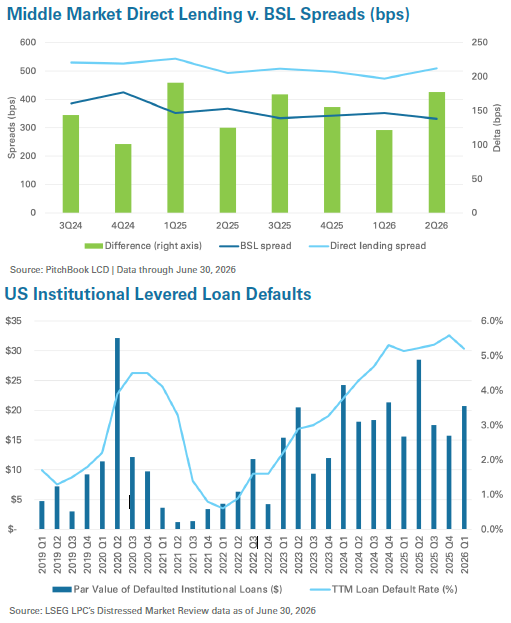
- Average middle market direct lending spreads moved from ~450 basis points in the first quarter to ~500 basis points in the second quarter. According to PitchBook LCD’s survey, investors expect spreads across middle-market private credit loans to stay the same or tighten quarter-over-quarter22.
- Software exposure remains a key focus for investors, as AI disruption and declining valuations weighed on parts of the technology sector this quarter. Lenders have become more cautious around software companies and over half of lenders in the LCD survey indicated they have reduced their exposure22. Software exposure across the top 12 largest BDCs dropped to 27% in the first quarter of 202623 . NEPC expects dispersion in performance to widen over time in this part of the market. The shift in lender sentiment has led to increased demand for other sectors; so far this year, technology has been displaced by healthcare as the largest sector in terms of the number of direct lending deals22.
- Notable deal: Medallia, a digital survey and customer feedback company, underwent a recapitalization in the second quarter. The lenders took ownership of the company from Thoma Bravo, the original private equity sponsor, that acquired the business in 2021. The recapitalization reduced Medallia’s debt burden, and the new ‘lender-owner’ group injected $150 million into the company to support growth22.

Performance24
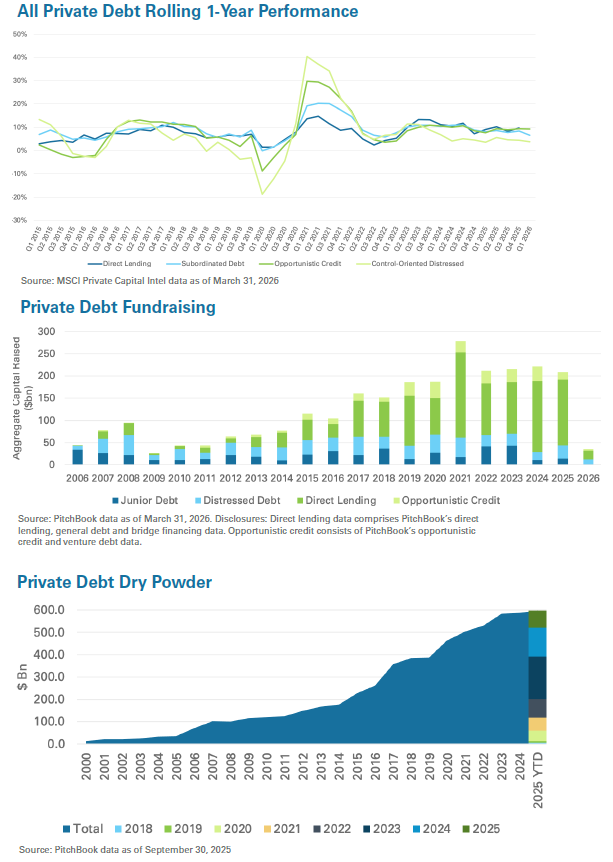
- Base rates for floating-rate loans are tied to the secured overnight financing rate (SOFR), which stands at 3.50%–3.75% on the heels of the Federal Open Market Committee decision on March 18, 2026, to keep its policy interest rate unchanged. Floating rate loans include first lien, unitranche and broadly syndicated loans (BSLs).
- Average all-in yields for middle-market direct lending deals (including first-lien and unitranche) increased slightly to 9.25% in the second quarter (vs. 9.13% in the first quarter).
- The yield premium for direct lending deals compared to the broadly syndicated market widened to 259 basis points in the second quarter.
- Average spreads on first-lien middle-market direct lending were slightly wider quarter-over-quarter at 502 basis points for the three months ended June 30.
- BSL spreads were modestly tighter quarter-over-quarter at 354 basis points in the second quarter.
Fundraising
- As of March 31, 2026, funds that held their final close in the first quarter of 2026 raised $35 billion in aggregate, per PitchBook data, trailing numbers from a year ago, but late-reporting funds may bridge the gap25.
- Direct lending continues to hold the largest share of capital raised in the quarter, though there have been meaningful fund raises across distressed and opportunistic credit mandates.
- In the first quarter, there was volatility across the retail channel. Capital inflows from this segment were sensitive to the effect of the “SaaS-pocalypse” and BDC managers are largely reporting net outflows during this period.
Deal Activity
- The direct lending market saw a meaningful slowdown in sponsor-backed LBO activity, particularly at the upper-end of the market, while the broadly syndicated loan (BSL) market regained market share22.
- Year-to-date direct lending LBO volume is approximately $32 billion (down 16%), and deal count is roughly 94 (down 15%)22.
- While overall volume is down, activity in the middle market has shown resilience. In the second quarter, sponsor-backed middle-market deals accounted for approximately 57% of total U.S. private equity activity. Direct lenders have not financed an LBO larger than $2 billion since March 202622.
- Strategies with the ability to source non-sponsored opportunities or capital solutions outside of the conventional LBO market may be better positioned to maintain deployment pace and structuring discipline amid this period of softer buyout activity for the direct lending market.
- There has been a rotation away from software as the largest source of new direct lending deals in 2026 YTD (by count)22. Lenders view healthcare businesses as less exposed to AI disruption and, therefore, relatively more attractive. Industrials are also benefiting from this rotation.
Valuations
- Across the top 12 largest publicly traded BDCs, the aggregate portfolio fair value-to-cost was marked near par at 99.5% in the first quarter.
- Software investments across BDCs are experiencing pressure on valuations.
- Across the largest publicly traded BDCs, software debt fair value-to-cost declined to 96.7% in the first quarter compared to 100.6% for non-software investments26.
- Software was not marked down dramatically, but the relative decline is significant with software being the largest active exposure across BDCs.
- On an amortized cost basis, software exposure declined to 27% of the top 12 largest BDCs26.
Exits
- Distribution activity is in line with 2024 and 202527.
- According to MSCI, the distribution-to-contribution ratios rose above 1.0x in 2024 ($19 billion net positive cash flow) and 2025 ($50 billion net positive cash flow). This trend continued in the first quarter of 2026, with $15 billion in net positive cash flow, suggesting loan repayments, refinancings and portfolio realizations are coming through private debt portfolios27.
- The TTM leveraged loan default rate has been declining steadily since January 2026. In February, it was 5.1%, 4.9% in March, 4.6% in April, 4.5% in May, and 3.8% in June28.
- The technology sector led default volumes in the first half of 202628.
Disclosures: Direct lending data comprises PitchBook’s direct lending, general debt and bridge financing data. Opportunistic credit consists of PitchBook’s opportunistic credit and venture debt data.
22 PitchBook 2Q26 US Private Credit & Middle Market Quarterly Wrap
23 PitchBook 1Q26 Warning Signs: Non-accruals, PIK discounts, and distress rise across top BDCs
24 LSEG LPC Middle Market Connect: The Middle Market Opportunity (published July 2026). Data coverage second quarter 2026
25 PitchBook Q1 2026 Global Private Market Fundraising Report; data as of March 31, 2026
26 PitchBook 1Q26 Warning Signs: Non-accruals, PIK discounts, and distress rise across top BDCs
27 MSCI Private Capital Benchmarks Report Q1 2026
28 LSEG LPC Distressed Market Review (July 2026)
Real Estate
Private real estate can play multiple roles in a portfolio, ranging from more income-oriented core and core-plus strategies to total-return-seeking opportunistic approaches. In recent years, real estate has experienced swings in valuations driven by the rapid fall and rise in interest rates. As the market finds its footing, we observe general liquidity, but many real estate investors continue to hold out for more favorable pricing, which has slowed distributions to investors.
Market Anecdotes
- Real estate valuations, represented by transaction cap rates, continue to show signs of stability after years of uncertainty. Cap rates for apartment and industrial assets remain around 5%, and the rolling four-quarter average for retail and office continues to experience cap rate compression29.
- The office sector remains challenged, but signs of a recovering supply and demand dynamic continue. Office vacancy experienced a small decrease year over year, and net absorption experienced its seventh straight quarter of improvement, reaching its strongest levels since 2020, according to a second quarter report from Cushman & Wakefield. Supply constraints are contributing to this trend, with new deliveries down 24% year-over-year30.
- Scale and consolidation have been a theme among private real estate managers for good reason: The top 10 real estate funds in 2025 accounted for 40% of all capital31. Though less discussed, a similar trend is playing out on the public side. The number of U.S. listed REITs has fallen from 223 at the end of 2020 to 189 as of May 2026, fueled by M&A activity as scale is increasingly required to be competitive32.

Performance
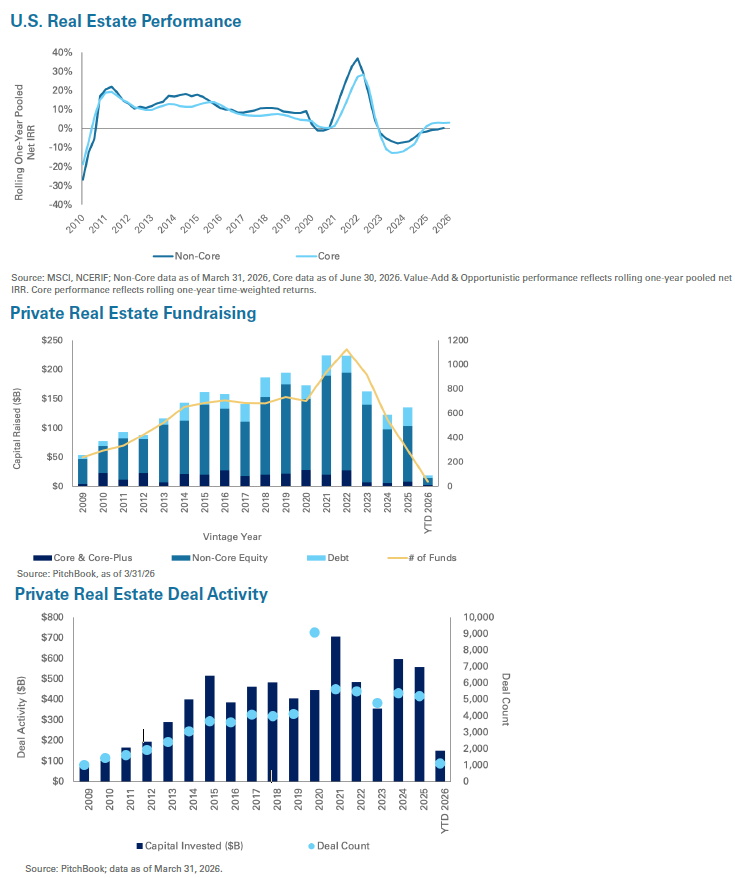
- While the core real estate recovery, as represented by the NFI-ODCE Index, has been slow overall, the second quarter of 2026 enjoyed increased momentum, with positive appreciation of 0.47% nearly doubling the 0.24% of positive appreciation seen in the first quarter; the total gross return for the second quarter was 1.49%.
- For the one-year period ending June 30, 2026, the ODCE generated slightly positive 0.36% appreciation and a 3.59% total net return33.
- With revised numbers, non-core real estate has now posted a positive return of 0.52%34 for the second straight quarter, following nearly three straight years of negative trailing one-year returns on the back of interest rate hikes in 2022.
Fundraising
- Real estate fundraising in 2025 increased modestly relative to 2024, though each of the last two years remains lower than any other individual year in the prior decade. Data from the first quarter of 2026 does not show a reversal of the overall slowdown in real estate fundraising.
- Large-cap managers are still dominating fundraising, as the number of funds in the market continues to fall.
- Non-core North American funds raised the bulk of the capital in the first quarter, though overall contributions were limited across the board.
- NEPC observes that overall commitment volumes continue to be hampered by the slow return of capital from older vintage funds.
Deal Activity
- Total deal count in the first quarter of 2026 slowed to the lowest level since the pandemic. Conversely, the volume of overall capital invested is on pace to be the second highest year on record.
- This trend indicates that deal sizes have continued to increase, consistent with the theme of the consolidation of capital within larger funds and managers.
Valuations
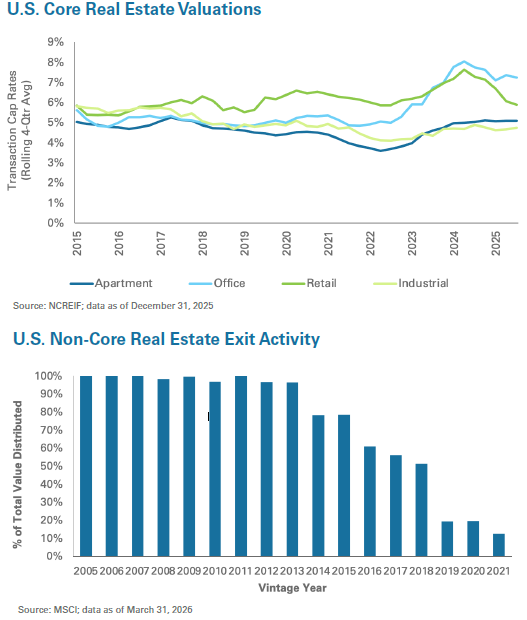
- Transaction cap rates mostly decreased in the first quarter of 2026, with a slight uptick for apartments, overshadowed by a larger compression in cap rates for office, retail, and industrial.
- The rolling one-year average cap rate for retail continues its sharp downward reversion as more capital has entered the space over the last year. Other asset classes remained more consistent over one-year averages, though office continues to hold the line as it drops from its high 2024 peaks.
Exits
- Closed-end real estate funds showed little change in distributions in the first quarter. Aggregate DPI remains below 1.0x for all vintages since 2016, while MSCI data shows that even top-quartile funds from 2019 and later vintages have produced DPI of 0.5x or less, underscoring the lack of meaningful distributions from funds that invested at or near peak valuations.
- Stabilizing property values and continued improvements in market liquidity should help support a healthier exit environment in 2026.
29 Source: NCREIF as of March 2026
30 https://www.costargroup.com/press-room/2026/us-office-leasing-reaches-strongest-quarter-2018
31 https://www.credaily.com/briefs/real-estate-fundraising-shows-signs-of-recovery-in-2026-market
32 https://www.reit.com/news/blog/market-commentary/us-reit-mergers-acquisitions-led-public-public-consolidation
33 Source: NCREIF as of June 30, 2026
34 Source: MSCI as of March 31, 2026
Real Assets
Real assets represent a broad array of underlying asset classes and sectors, including hard assets, for instance, infrastructure, and natural resources such as energy private equity. Real assets exhibit differentiated returns relative to other asset classes, offering potential diversification benefits for investors. Many real asset investments include a current income component, the potential for capital appreciation, and a partial hedge against inflation. In recent years, infrastructure has received a lot of attention from investors, resulting in the rapid growth and evolution of the infrastructure investment landscape.
Market Anecdotes
- As data center investment continues to grow, local opposition to new developments is accelerating alongside it. Nearly $100 billion in projects were blocked or delayed between late March and June of 202635. In efforts to address community concerns over power, water and pollution, hyperscalers have increasingly turned to generating their own power on-site rather than drawing from local grids. However, that workaround has not necessarily eased local resistance and, at times, has invited additional concerns36. The persistence of opposition even when the grid burden is removed suggests it may be hardening into something broader than concerns about any single project.
- The largest deal in infrastructure in the second quarter was a bet on sustained power demand: NextEra and Dominion announced an all-stock merger in May 2026 to form the largest U.S. regulated utility, at a roughly $420 billion enterprise value. Scale is central to the thesis: serving data center-driven load growth takes enormous and sustained capital, while a larger balance sheet lowers the cost of funding while spreading execution and regulatory risk across a wider base of assets and service areas37.
- The U.S. Strategic Petroleum Reserve has reached its lowest level since 1983, less than half of its capacity. Never fully rebuilt after the drawdown that followed Russia’s invasion of Ukraine, the reserve has now absorbed a second shock, with the government tapping it again during the Iran war to blunt the impact on U.S. consumers from the disruption to traffic through the Strait of Hormuz38. The diminished buffer will persist for years because the reserve refills far more slowly than it draws down, leaving less cushion against the next potential supply shock.

Performance
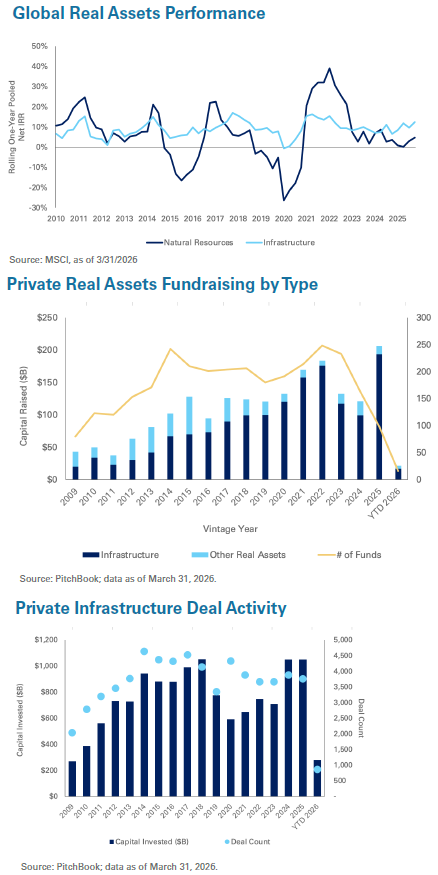
- Natural resource prices enjoyed a strong uptick in the first quarter as the Iran war and continued geopolitical instability increased supply side concerns for oil and gas and other commodities.
- Private infrastructure continues to demonstrate strong stability and performance, with only one negative rolling one-year period since the global financial crisis, which occurred during the market disruption that ended in March 2023. The rolling one-year return is 10.47% and has maintained a consistent low double digit return in most of the recent quarters.
- Private natural resources also ended the first quarter on a strong note, posting their best rolling one-year return in nearly two years. However, the asset class has exhibited materially less stability than infrastructure, with significantly wider swings in returns and more pronounced peaks and troughs over the past 15 years39.
Fundraising
- Following a record year for infrastructure and real asset fundraising in 2025, the first quarter of 2026 represented a pullback, at just over 10% of total 2025 fundraising. Total first quarter fundraising was also lower than the first quarter in four of the past five years.
- Within sector specific fundraising, 87% went to renewables, power and transmission strategies, a meaningful increase from prior periods, underscoring the role of the power sector in many facets of the economy.40
- Like recent years, the number of funds in the market has decreased despite fundraising continuing to trend upward over longer time periods, consistent with the broader theme of capital consolidating around large-cap managers.
Deal Activity
- Deal activity in the first quarter of 2026 was largely consistent with the prior year, with capital invested outpacing 2024 and 2025, and deal count slightly lagging, though both numbers are within the same historical range.
- Average deal size has increased as fundraising has become increasingly concentrated among large-cap managers. While the number of transactions has declined over the past five years, total capital deployed continued to rise, reflecting a shift toward fewer but larger deals.
- Brookfield tested the market with a minority listing of Csquare, a data center operator. It priced below its marketed range and slipped further in its trading debut, suggesting investors were not willing to pay an AI premium for an enterprise colocation business despite the deal being widely framed as an AI infrastructure play41.
Valuations
- Digital Realty agreed to acquire Blackstone’s stake in three fully leased Northern Virginia data centers at a gross value of $7.8 billion, implying an expected initial stabilized cap rate of just over 5%. With private marks on the data center largely appraisal-driven, an arms-length yield on an investment-grade-leased hyperscale product gives investors a benchmark to test those valuations against42.
- NEPC observes that digital infrastructure continues to attract investor capital, and the power sector is seeing renewed interest, causing some to express concern over valuations should competition for deals continue to increase. CBRE has projected future returns in the digital sector to moderate towards a long-term return profile in the low teens43.
Exits
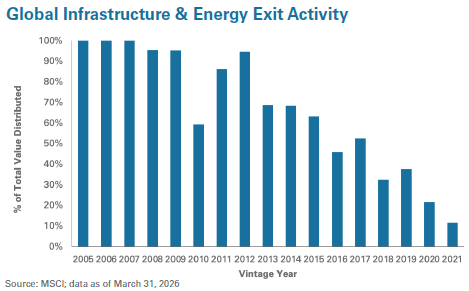
- At a high level, infrastructure distributions remain unchanged quarter-over-quarter, though 10+ year old funds continue to see moderate improvement.
- While infrastructure performance remains steady relative to other parts of the private markets landscape that have experienced increased volatility, the infrastructure universe has also seen the growing trend of continuation vehicles, extended fund lives, and slowed distributions.
For questions on your private markets portfolio, or to discuss current market trends and opportunities, please reach out to your NEPC consultant.
35 https://www.nbcnews.com/politics/economics/state-local-opposition-new-data-centers-gaining-steam-rcna243838
36 https://techcrunch.com/2025/06/18/xai-is-facing-a-lawsuit-for-operating-over-400-mw-of-gas-turbines-without-permit
37 https://www.utilitydive.com/news/nextera-dominion-merger-would-create-worlds-largest-regulated-electric-ut/820457
38 https://www.cbsnews.com/minnesota/news/what-is-the-strategic-petroleum-reserve
39 Source: MSCI data as of 12/31/25
40 https://www.cbreim.com/insights/articles/infrastructure-quarterly-q2-2026
41https://www.iposcoop.com/the-ipo-buzz-csquare-csqr-prices-ipo-at-21-2-below-range
42 https://www.blackstone.com/news/press/digital-realty-announces-purchase-of-blackstone-interest-in-three-northern-virginia-data-centers
43 https://www.cbreim.com/insights/articles/infrastructure-quarterly-q2-2026
44https://www.jefferies.com/insights/markets/infrastructure-secondaries-hit-their-stride-a-once-niche-corner-of-the-market-could-reach-30-billion-in-2026
For questions on your private markets portfolio, or to discuss current market trends and opportunities, please reach out to your NEPC consultant.