Growth stocks lagged in July as enthusiasm for AI-related companies cooled while value maintained its lead, besting growth by the widest margin in over 25 years. The Russell 1000 Value Index gained 3.8% as its growth counterpart lost 4.8%, an 860-basis point-margin only surpassed four times, around the dot-com era between 1999 and 2001.
Despite worries around the concentration of growth equities within the S&P 500, the index declined a modest 0.1% in July; during this period, the MSCI Emerging Markets Index lost 3.1% as AI- and growth-centric companies in Korea and Taiwan dragged down returns. Meanwhile, the MSCI EAFE Index was up 2.0%—a rare feat in a growth-dominated market—further underscoring the disparity between value and growth stocks.
The Federal Open Market Committee kept its policy rate unchanged at a range of 3.50%-3.75% at its July meeting, overcoming a small cohort of dissenting votes that were in favor of a rate hike. Inflation data remains persistently elevated above the Federal Reserve’s target level of 2.0%, and after seven months and five meetings of no changes in policy, three committee members voted in favor of a rate hike.
In real assets, spot WTI crude oil surged almost 20% in July as tensions between the U.S. and Iran escalated again. As the situation in the Middle East remains fragile, we anticipate continued volatility in energy prices as traffic within the Strait of Hormuz remains constrained. Within the precious metals space, spot gold prices inched higher, rising 0.9% in July.
We encourage investors to fully utilize the portfolio risk budget. We also recommend maintaining an overweight to U.S. stocks within public equity allocations, given the supportive macroeconomic backdrop and earnings strength across the U.S. market. We continue to advise that investors hold high-quality, liquid assets, and suggest holding safe-haven fixed-income securities at strategic target levels to support portfolio liquidity. We also advise shying away from liquid segments of lower-quality credit given tight spread levels and market sentiment.
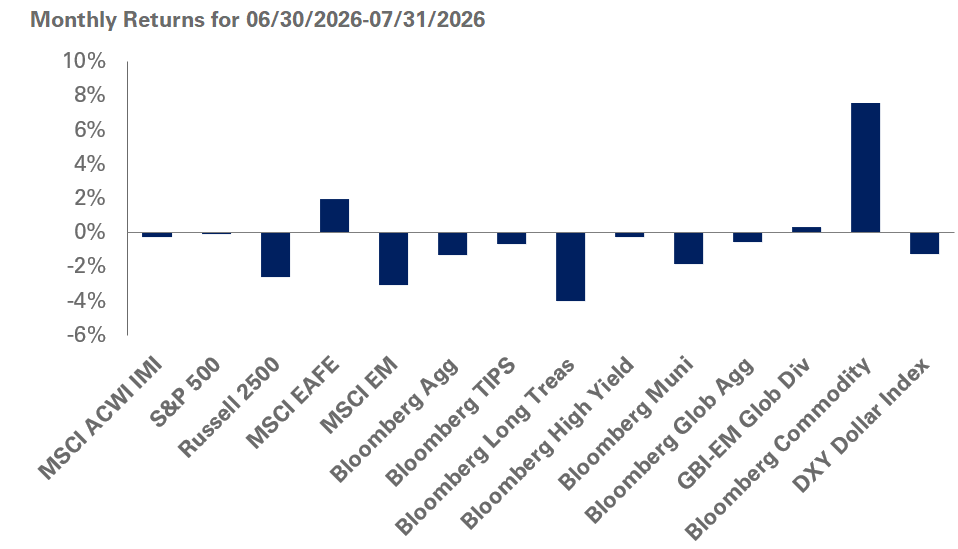
As of 7/31/2026, Source: S&P, Russell, MSCI, JPM, Bloomberg, Factset