Global Equities
Equities were in for a wild rollercoaster ride in the second quarter, staging a significant comeback following steep dips as concerns around tariffs receded into the background and markets shrugged off geopolitical conflicts amid optimism around the passage of Trump’s so-called Big, Beautiful Bill. In a testament to the market unrest, the VIX Index, a reliable gauge of volatility, crossed 50 during the quarter—levels last seen during the global financial crisis and pandemic—subsequently settling down as investors’ concerns abated.
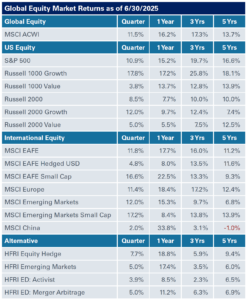
During this time, the S&P 500 Index posted its worst week since the Covid pandemic amid announcements of harsh tariffs, only to reverse course as the administration walked back on the timing and severity of its trade policies, sending the S&P 500 surging to new highs with gains of nearly 11% for the quarter. For the three months ended June 30, large-cap growth equities bested value, while the Russell 2000 Index gained 8.5%.
Overall, emerging markets posted a strong performance with gains of 12% in the second quarter, bolstered by improving trade dynamics, strong performance in South Korea and Taiwan, and renewed appetite for risk. Non-U.S. developed markets returned 11.8%, buoyed by a weaker dollar, fiscal stimulus in Europe and rate cuts from the European Central Bank.
Meanwhile, U.S. private equity fundraising activity was stagnant in the second quarter, with $149 billion raised, modestly down from $155 billion a year earlier, according to data from PitchBook. U.S. venture capital fundraising totaled $26.6 billion, compared to $37.4 billion a year ago. In terms of fund count, 146 private equity and 238 venture funds have closed so far this year compared to 129 private equity funds and 255 venture funds a year earlier.
New deal activity in U.S. private equity grew to $506.7 billion in the second quarter from $325.2 billion a year earlier, according to PitchBook. During this time, U.S. venture capital new deal activity also increased significantly, totaling $162.8 billion in deal value compared to $93.4 billion a year ago. Exits in private equity-backed companies cooled off from the beginning of the year but still remain strong, totaling $339.8 billion across 732 transactions, compared to $141.4 billion across 626 exits a year earlier. Exit activity was also up for U.S. venture, representing its highest quarter of activity since 2021, with $120.1 billion in value across 756 deals compared to $49 billion across 634 deals last year.
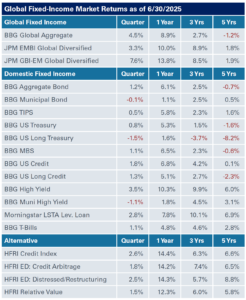
Global Fixed Income
In fixed income, tariffs took center stage, spurring volatility as investors grappled with the trade policies of the new administration and the potential impact on markets and economies. As expected, the Federal Reserve held rates steady, while emphasizing its data-dependent approach to monetary policy and need for greater clarity around the impact on growth and inflation from tariffs before adjusting monetary policy. The central bank’s economic projections showed a narrower split among committee members around potential cuts to the Fed Funds rate. The market continues to price in modest future easing with little consensus on the timing and magnitude.
While most international sovereign rates declined over the quarter, as measured by 10-year government bond yields, the yield on the 10-year Treasury note was relatively unchanged, up a modest two basis points. Meanwhile, the U.S. Treasury yield curve steepened, with the three-year note lower by 19 basis points to yield 3.68%, while the long bond (as measured by 30-year yield) rose 21 basis points to end the quarter at 4.78%.
Within corporate credit, softening rhetoric and extension of timelines around tariffs allowed for a gradual recovery in spreads in late April and May on the heels of weakness in early April. The rally in spreads continued into June, fueled by strong investor demand for credit and limited new issuance. This was especially true in longer-dated maturities which contributed to persistently flat credit curves. For the three months ended June 30, the risk premiums on investment-grade corporate bonds tightened 10 basis points, while the spreads on high-yield corporate debt tightened 59 basis points to end the quarter below 300 basis points, reversing the spread widening in the first quarter. Similarly, emerging market debt (hard currency) recovered from the 40 basis points widening in the first quarter to finish flat year to date.
During the quarter, most major fixed-income indexes posted robust returns due to spread compression on top of relatively strong yields to start with. The Bloomberg Aggregate Bond Index rose 1.21% in the second quarter, resulting in a trailing 12-month return of 6.08%. Meanwhile, the Bloomberg U.S. Corporate High Yield Index returned 3.53% during the quarter, generating a solid 12-month trailing return of 10.29%.
Real Assets
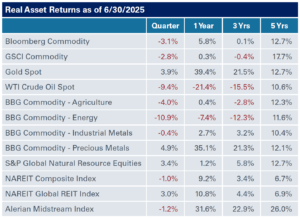
Commodities bore the brunt of market volatility with the Bloomberg Commodity Index down 3.1% in the second quarter; the index is up 5.5% so far this year. During this time, the WTI Crude Oil Spot fell 9.4%, and is down 10.1% year-to-date as oil and gas prices continue to fluctuate. Despite challenges in the commodity and energy markets, other real asset segments provided a bright spot for investors. The gold spot price finished the second quarter up 3.9% and the S&P Global Infrastructure Index gained 10.4%.
While the public real assets space continues to absorb the implications from tariffs and geopolitical conflicts, certain areas remain steady. Within private infrastructure, we continue to find attractive investment themes, with increased deal flow and long-term tailwinds in the digital, transportation, and energy transition sectors. Our preferred approach is one of diversification across real assets in public and private sectors, with a preference for private markets when it comes to implementing infrastructure and other real assets in an investment portfolio.
Elsewhere, private real estate returns remained modestly positive in the second quarter for stabilized properties with the NFI-ODCE Index reporting a gross return of 1.03%, driven by an income return of 1.01% and an appreciation return of 0.02%; appreciation returns have remained relatively flat over the past few quarters as capital markets continue to slowly recover from two straight years of negative quarterly returns. While transaction volume has increased year-over-year, there has been a slight pullback due to macroeconomic concerns from both lenders and asset owners. Fundamentals remain positive for most sectors, though rent growth in select industrial and multifamily markets has softened due to recent oversupply after both property sectors enjoyed several years of exceptional rental growth. Office continues to experience negative absorption, although flight to quality persists in the leasing market providing pockets of opportunity for investors. NEPC believes that real estate capital markets will continue to slowly recover as investors gain more economic clarity and capital markets normalize.
The FTSE NAREIT All Equity REITs Index posted a 1% loss for the three months ended June 30. Recent interest rate fluctuations and shifts in trade policy have impacted property sub-sectors differently, though the focus on fixed-rate long-term debt, combined with access to cost-effective capital, has largely protected REITs from rising cost of debt. The top performing REIT sectors in the second quarter were specialty sectors, data centers, and lodging/resorts, while apartment and industrial REITs were among the worst performers amid concerns around tariff and job growth.
Given the recent market dynamics, we encourage investors to remain disciplined and stick to long-term strategic asset allocation targets. We believe volatility is likely to persist until greater clarity emerges around the administration’s policy on tariffs and tariff rates. As a result, we recommend investors hold adequate liquidity on hand for cash flow needs, while taking advantage of opportunities to rebalance into equities and Treasuries.