Global Equities
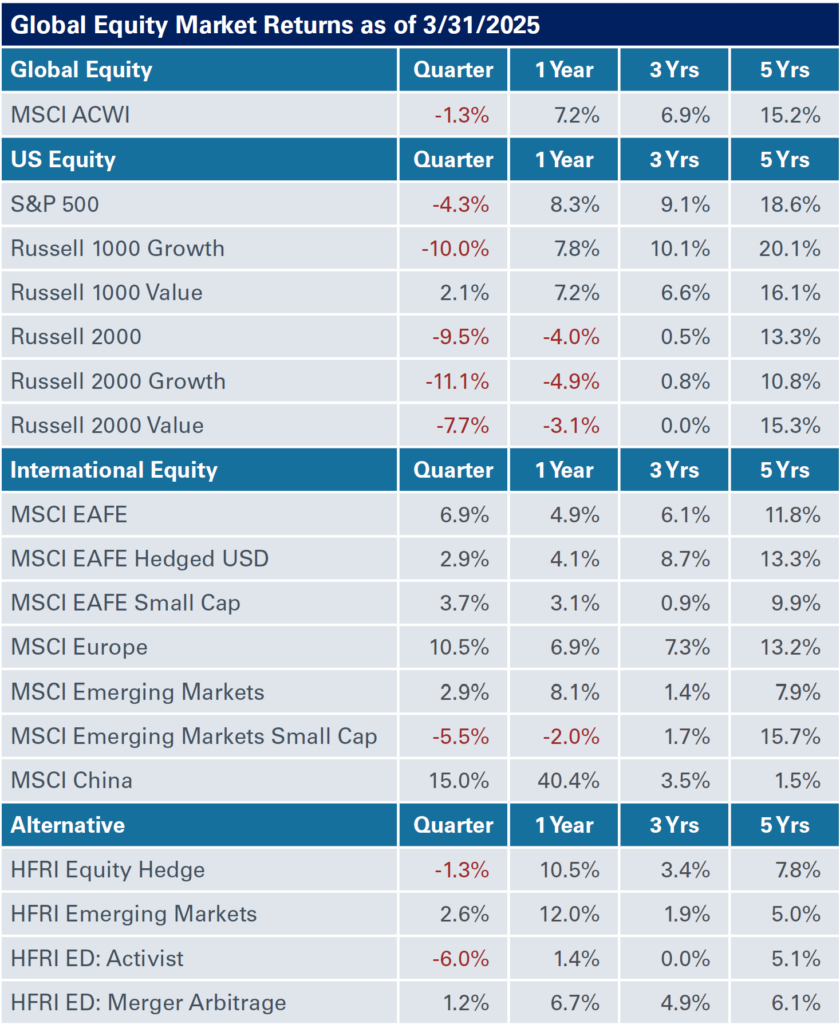
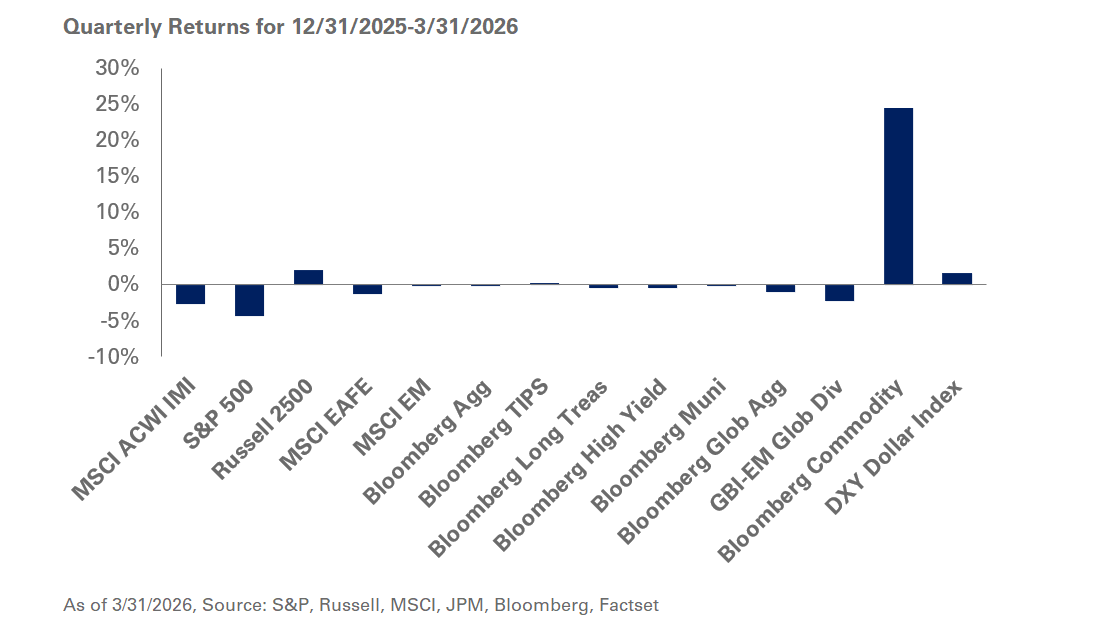
Stocks were a mixed bag in the first quarter with international equities broadly outperforming their U.S. counterparts. MSCI EAFE Index led the way, returning 6.9% with MSCI ACWI ex-US a close second with gains of 5.2%. The S&P 500 Index sold off, losing 4.3% for the three months ending March 31, amid increased market volatility and uncertainty around tariffs. During this period, value stocks bested growth equities with gains of 2.1% for the Russell 1000 Value Index and losses of 10% for the Russell 1000 Growth Index.
Meanwhile, U.S. private equity fundraising activity remained sluggish in the first quarter, with $56.7 billion raised, down from $76.8 billion a year earlier, according to PitchBook. U.S. venture capital fundraising totaled $10 billion, up modestly from $9.3 billion a year ago. In terms of fund count, 79 private equity and 87 venture funds closed this quarter compared to 63 private equity funds and 100 venture funds a year earlier.
New deal activity in U.S. private equity grew to $259.7 billion in the first quarter from $145.4 billion a year earlier, according to PitchBook. During this time, U.S. venture capital new deal activity also ballooned, totaling $91.5 billion in deal value—a record high for a quarter since 2022—compared to $36.6 billion a year ago.
Exits in private equity-backed companies were off to a strong start this year, totaling $186.6 billion across 402 transactions, marking the highest first quarter exit volume in the past five years. Exit activity was up too for U.S. venture, with $56.2 billion in value across 385 deals, underscoring the highest quarterly exit value since Q4 2021.
Global Fixed Income
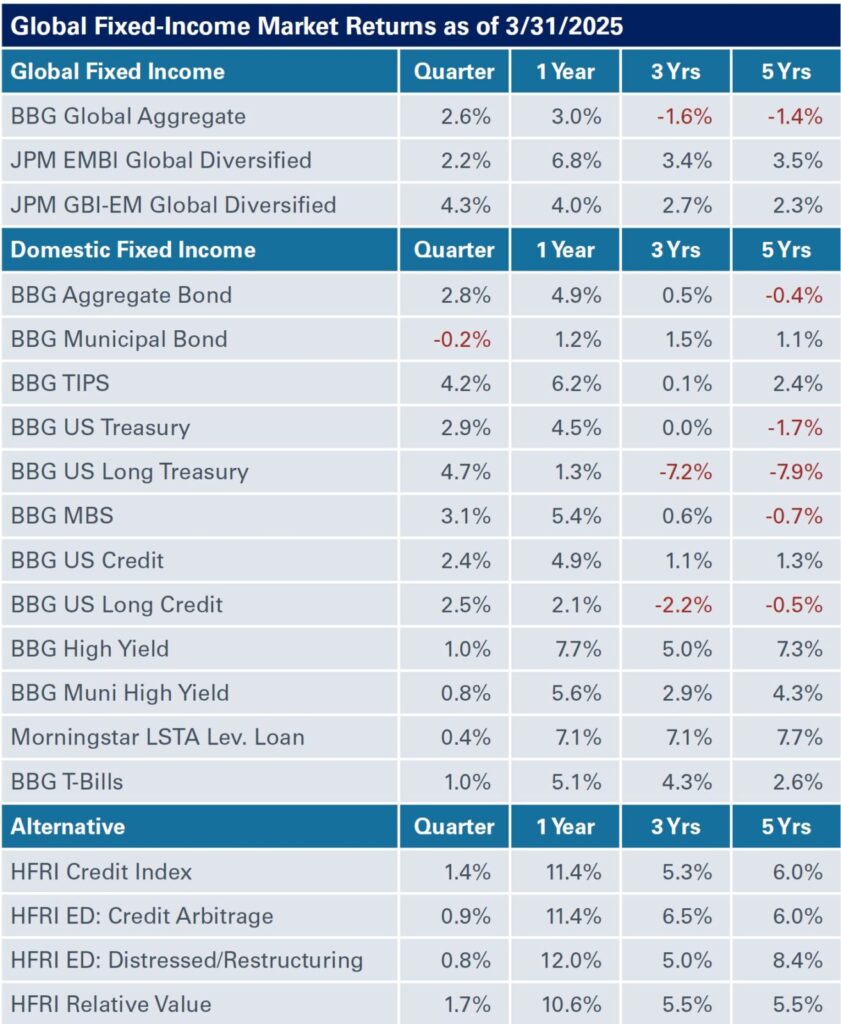 Interest rates continued their see-saw pattern in the first quarter with Treasuries experiencing yet another reversal, rallying during the quarter on the heels of 2024’s selloff with yields moving lower across the curve. The FOMC held rates at 4.25%-4.50% at the March meeting adopting a wait and see approach as it evaluates the inflationary implications of tariffs before potentially lowering rates. Credit spreads were modestly wider across fixed-income markets, but remained substantially below long-term median levels.
For the three months ending March 31, the spread on investment-grade corporate bonds widened 14 basis points, while high-yield corporate bond spreads were wider by 60 basis points; emerging markets debt (hard currency) widened 40 basis points.
In the rates markets, the yield on the five-year Treasury declined 42 basis points to end the quarter at 3.96%, while the 30-year Treasury bond yield fell 31 basis points to 4.59%. In sharp contrast to the U.S. market, developed sovereign yields outside the U.S. were slightly higher on average.
Despite the wider spreads, most major fixed-income indexes were in the black. The Bloomberg Aggregate Bond Index rose by 2.8% in the first quarter, resulting in a trailing 12-month return of 4.9%; below-investment grade returns lagged on wider spreads with less overall duration. The Bloomberg U.S. Corporate High Yield Index returned 1% in the first quarter but still posted a solid 12-month trailing return of 7.7%.
Real Assets
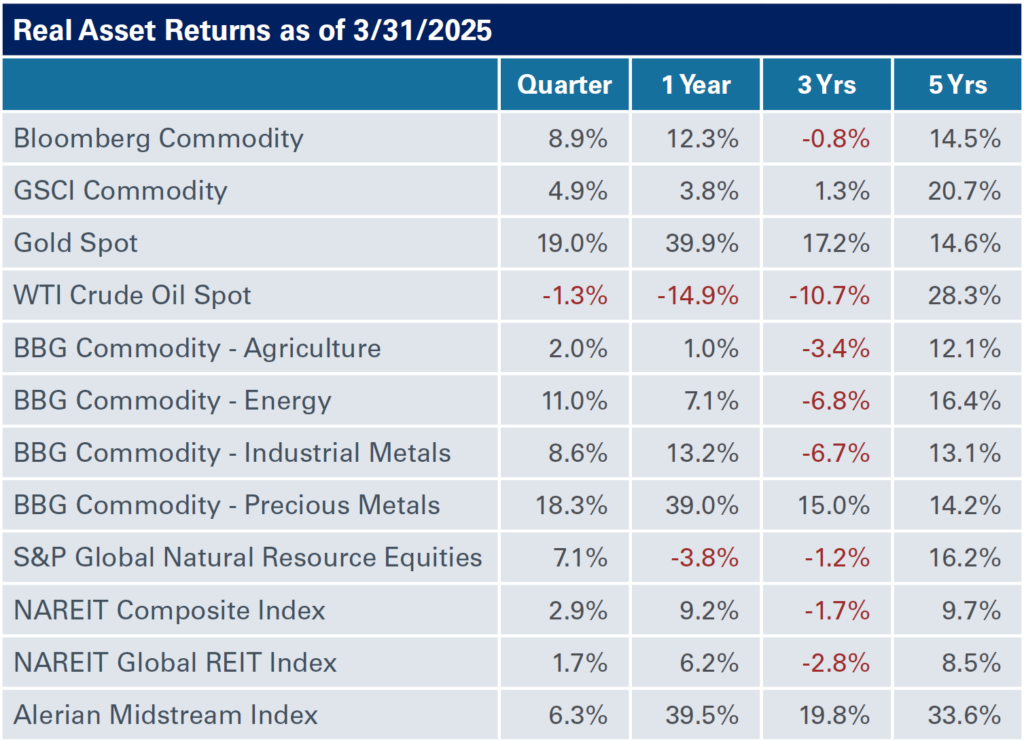 Liquid real asset classes turned in a strong performance in the first quarter. The Bloomberg Commodity Index was up 8.9%, though crude oil dropped by a modest 1.3% in the three months ending March 31. Midstream had a robust quarter as well, with the Alerian Midstream Index up 6.3%. Coming off a strong 2024, gold (spot price) led performance among real assets, with a 19% return in the first quarter.
Global natural resources were also off to a winning start, with the S&P Global Natural Resources Index posting returns of 7.1% for the quarter. Elsewhere, the S&P Global Infrastructure Index gained 4.6%.
Meanwhile, REITs recovered a portion of their losses from the fourth quarter with the NARIET Global REIT Index up 1.7% in the three months ending March 31. The NCREIF ODCE posted a preliminary gross return of 1.05%, inclusive of 0.04% of asset appreciation. While still muted, this is the second straight quarter of asset appreciation for the NCREIF ODCE following two consecutive years in the red.
Real estate debt—despite its more conservative position in the capital stack—remains a bright spot as higher interest rates, impending loan maturities, and pullback from traditional lenders have led to higher return expectations that rival potential gains from value-add real estate equity strategies. On the other end of the spectrum, opportunistic and distressed real estate investors may be able to capitalize on these same market dynamics to acquire high-quality assets suffering from capital structure issues. Managers of secondaries have also benefitted, particularly as general partners seek creative solutions to recapitalize assets that have a limited buyer pool but retain value and upside. NEPC remains committed to a barbell approach to investing in closed-end real estate funds.
Private infrastructure strategies continue to garner interest from investors, and we are particularly constructive on tailwinds driving digital and communications infrastructure, renewable energy and energy transition strategies. Middle-market strategies that are focused on a local market also have tailwinds and may be more insulated from global trade pressures. We also view infrastructure secondaries as broadly attractive and are supportive of infrastructure debt for investors with a lower risk tolerance or a preference for income.