Introduction
Private market investments are making up an increasingly larger share of institutional and individual portfolios. Private market investments can generate a return premium to public markets but require tradeoffs in liquidity, fees, and complexity. In this quarterly report, NEPC’s investment team outlines our views on private markets. As always, we remain committed to helping our clients successfully run private market investment programs in the face of uncertainty and change.
Private markets strategies today exhibit many common themes:
- Liquidity: Toward the end of the year exit activity accelerated across the buyout, venture and private credit asset classes. Continuation vehicles (including second-generation continuation vehicles), secondary sales, and credit restructurings served as key liquidity levers for general partners (GPs). M&A activity also strengthened in the final quarter of 2025, providing much‑needed liquidity across the market. Throughout the year, secondary sales have become increasingly common for limited partners (LPs), and largely destigmatized, tools for portfolio management. As the commitment‑pacing and planning season begins, many LPs are reassessing the relevance of historical assumptions around growth rates and fund lives across private market strategies.
- Flight-to-quality: In the context of fundraising, deal-making and exits, bigger GPs and large deals are driving activity across private equity, private debt and real estate/assets. As a result, this segment of the market is more competitive as LPs and GPs seek quality. We see opportunities in smaller funds and deals across credit, equity and real assets.
- Artificial intelligence: This investment theme is now woven into many private market strategies, from venture capital to buyouts to real estate and infrastructure. AI valuations continue to march higher, and we are careful to parse quality AI investments from those swept up in the market’s enthusiasm.
- Rise of wealth: Individual investors are increasingly seeking exposure to private markets in their portfolios via rapidly expanding semi-liquid vehicles. Morningstar issued its inaugural ratings of semi-liquid funds in September 2025, further cementing the theme of public and private market convergence.1
- Industry consolidation: Consolidation is a classic sign of a mature industry. Many consolidation deals have been done under the banner of democratizing private markets (alternatives offerings grow a company’s multiple) or to inject liquidity into a GP for succession management or expansion. Examples include Goldman Sachs’ acquisition of Industry Ventures and Blackrock’s acquisitions of Global Infrastructure Partners and HPS private credit.
1 https://newsroom.morningstar.com/newsroom/news-archive/press-release-details/2025/Morningstar-Publishes-
First-Medalist-Ratings-for-Semiliquid-Funds/default.aspx)
Buyouts
Buyouts remain a core component of many investors’ private markets portfolios. High‑quality assets continue to change hands, with the fourth quarter showing an uptick in exits to financial sponsors and strategic acquirers. Many GPs are holding assets that are “long in the tooth” (U.S. PE inventory includes 13,000 companies, and roughly 30% of U.S. PE‑backed assets are over seven years old), LPs are increasing pressure to transact, to support future fundraising.2
NEPC’s buyout team remains focused on the small end of the market, where opportunities for growth and a broader set of exit paths often create more favorable dynamics. Periods of uncertainty such as this can also present compelling entry points for deploying new capital into private markets.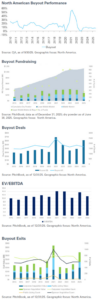
Market Anecdotes
- Aligned Data Centers (~$40 billion): A consortium led by BlackRock and MGX (Abu Dhabi) acquired the data‑center operator, with participation from Nvidia, Microsoft and xAI. The transaction underscores the significant focus on AI‑driven digital infrastructure.3
- Air Lease (~$28.2 billion): A major transaction structured with a mix of equity and hybrid credit financing led by Apollo Asset Management, Brookfield Asset Management and other co‑investors.4
- Hologic (~$18 billion): Blackstone and TPG completed the acquisition of the medical diagnostics company following an enhanced offer that was ultimately accepted.5
Performance
- Performance has strengthened after bottoming out in 2022.
- The lack of distributions points to the fact that most of the performance is attributable to unrealized (paper) gains rather than realized capital gains returned to LPs.
Fundraising6
- The trend of sluggish fundraising continued through the end of 2025, primarily driven by limited partners adopting a more cautious approach to capital deployment. This shift is largely due to a slowdown in distributions, which has constrained ability to recycle capital into new commitments.
- U.S. buyout fundraising was 27% lower from 2024 in total dollars raised and 52% in terms of number of funds. U.S. buyout funds raised $277 billion so far in 2025, down from $381 billion in 2024.
- 49% of total capital raised in 2025 has been allocated to larger funds.
Deal Activity7
- Deal activity in 2025 continued to rebound, with aggregate value increasing 57% year‑over‑year, from $392 billion in 2024 to $617 billion so far in 2025.
- Drivers: Risk projections around a potential recession remain low. The Fed’s modest rate cuts, combined with public markets reaching record highs, are fueling risk‑on sentiment.
- PitchBook reports that U.S. take‑private transactions totaled 80 in 2025, an 18.4% decline from 98 in 2024. However, deal value rose to $255 billion, a 67% year‑over‑year increase, suggesting that 2025 activity was driven by a smaller number of very large transactions.
- According to PitchBook, U.S. buyout median valuation multiples (enterprise value/EBITDA) declined to 12.0x in 2025 from 13.4x in 2024. Debt‑to‑EBITDA median multiples also edged down to 5.0x in 2025 from 5.2x in 2024.
- In 2025, 4,509 smaller bolt‑on acquisitions were completed, compared to 4,950 in 2024.
- PitchBook also tracked 147 exits to continuation funds in 2025, totaling $95.8 billion.
Valuations8
- Valuations have increased relative to 2023—rising to 11.2x in 2025 from 10.2x in 2023. However, this marks a decline from the 12.8x observed in 2024.
- As expected, the median valuation started to decline in late 2025 and is expected to continue into 2026 as balance sheets come under pressure and lower-quality deals come to market.
Exits9
- Year‑to‑date U.S. private equity exit activity is the strongest since 2021, with total exit value reaching $682 billion, up from $383 billion last year. However, the number of exits is down relative to 2024, indicating that quality continues to drive transaction flow.
- Median holding periods for U.S. private equity–backed companies have also begun to decline from their 2023 peak. The current median has fallen to six years, reflecting improved exit activity, though it remains above the pre‑pandemic median of 5.5 years.
- With valuations rising and transaction volume still subdued, the highest‑quality assets continue to change hands. The key test will come as bid‑ask spreads narrow for lower‑tier assets. Notably, mega‑exits accounted for 78% of year‑end exit value.
2 Source: Pitchbook, US Private Equity Outlook, as of December 3, 2025.
3 https://www.cnbc.com/2025/10/15/nvidia-microsoft-blackrock-aligned-data-centers.html
4 https://usaherald.com/apollo-and-brookfield-acquired-air-lease-in-28-2b-mega-deal/
5 https://investors.hologic.com/press-releases/press-release-details/2025/Hologic-to-be-Acquired-by-Blackstone-and-TPG-for-up-to-79-per-Share/default.aspx
6 Source: Pitchbook as of December 31, 2025 unless otherwise stated.
7, 8, 9 Source: Pitchbook as of December 31, 2025 unless otherwise stated.
Venture Capital
Venture capital can provide return enhancement to investment programs, but manager selection is paramount. The IPO market has reopened, but access remains limited to top-tier companies. Although up from 2024, substantial exits remain scarce, putting strain on over-allocated portfolios. This has also contributed to a slowdown in overall fundraising. Assuming no major economic disruptions, there are signs that distributions are expected to increase in 2026 considering the backlog of IPO-ready companies.
AI has dominated the narrative across the industry, with many managers crowding this space to gain exposure. We anticipate that valuations for non AI companies with weaker earnings will begin to come under pressure. This may result in performance degradation among lower-quality firms, leading to a wider dispersion of returns.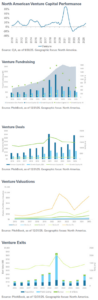
Market Anecdotes
- Anthropic is reportedly close to finalizing a major new funding round, targeting approximately $20 billion at a valuation near $350 billion, a significant increase from its $183 billion post‑money valuation in August 2025.10
- NVIDIA announced a $20 billion acqui-hire and licensing agreement with Groq to acquire the company’s senior team and license its technology. The transaction is expected to strengthen NVIDIA’s competitive position in the inference market, where specialized chips can deliver inference at a fraction of the cost of its most advanced products, which support training and inference workloads. The structure of the deal appears designed to minimize regulatory scrutiny given the technological overlap between the two companies.11
- Cerebras, another competitor in the inference‑focused semiconductor space, is reportedly raising capital at a rumored $22 billion valuation, up from an $8 billion valuation in September 2025. This effort follows the company’s recent $10 billion agreement with OpenAI, as OpenAI continues diversifying its chip supply stack.12
Performance
- Performance appears to be strengthening after bottoming out in 2022. AI companies remain key drivers of performance.
- The lack of distributions underscores the fact that most of the performance is attributable to unrealized (paper) gains rather than realized capital gains returned to LPs.
Fundraising13
- The trend of sluggish fundraising continued through the end of 2025, primarily driven by limited partners adopting a more cautious approach to capital deployment. This shift is largely due to a slowdown in distributions, which has constrained ability to recycle capital into new commitments.
- Total capital raised 2025 across venture and growth equity was $117 billion across 595 funds, significantly down from the peak in 2022.
- After a period of stabilization in 2024, levels of dry powder have begun to rise again in 2025, signaling renewed availability of capital across the venture landscape. This increase is partly driven by the substantial capital raised in 2022 and 2023 that remains undeployed. Moreover, despite a slowdown in overall fundraising activity in 2024 and 2025, capital formation continues, and leading platforms are still able to attract significant commitments. This momentum is expected to persist until earlier vintage funds begin deploying capital more actively.
Deal Activity14
- Deal volume increased significantly in 2025. Venture capital and growth equity firms deployed $456 billion across 16,378 deals, according to PitchBook – nearly matching the 2021 peak, when $479 billion was deployed across 21,462 deals.
- While deal value remained strong in 2025, the number of completed transactions continued to decline, suggesting a perceived flight to quality. This dynamic appears to be driven largely by heightened enthusiasm around AI and a prevailing fear of missing out. AI-related investments accounted for $222 billion in deal value and more than 5,793 completed transactions in 2025, representing approximately 39% of all deals completed during the year.
Valuations15
- Valuations in 2025 are gradually increasing in the earlier rounds and have soared in the later stages, driven by high‑quality companies and strong momentum in AI‑related businesses.
- In 2025, AI and the machine learning sector have dominated activity, accounting for 65% of total venture deal value.
- Later‑stage rounds are approaching record valuations. The median pre‑money valuation for Series C rounds has reached $316 million, surpassing the 2021 peak of $281 million.
Exits16
- Venture capital recorded its highest exit value since 2021. Notably, 71% of acquisitions during this period occurred at or before the Seed or Series A stage.
- While the IPO market has reopened, access remains limited to top‑tier companies. In 2025, there were 66 public listings generating a combined exit value of $119 million, representing 40% of total exit activity for the year. Notable initial public offerings included CoreWeave, Figma and Chime Financial.
- Median years since last funding remain elevated compared to the pre‑COVID period (2015–2022). For later‑stage companies, the Series D+ median has increased to 10 years.
10 https://techcrunch.com/2025/11/04/anthropic-expects-b2b-demand-to-boost-revenue-to-70b-in-2028-report/
11 https://www.axios.com/2025/12/29/nvidia-groq-inference-chips
https://www.wsj.com/business/deals/nvidia-20-billion-groq-deal-9f8d3a5b?gaa_at=eafs&gaa_n=AWEtsqcWb…
12 https://techcrunch.com/2026/01/14/openai-signs-deal-reportedly-worth-10-billion-for-compute-from-ce…
https://www.reuters.com/technology/openai-buy-compute-capacity-startup-cerebras-around-10-billion-w…
https://www.bloomberg.com/news/articles/2026-01-13/cerebras-in-discussions-to-raise-funds-at-22-bil…
https://www.forbes.com/sites/karlfreund/2026/01/15/cerebras-ai-lands-a-whale-as-it-prepares-to-go-p…
13 Source: Pitchbook as of December 31, 2025 unless otherwise stated.
14, 15 Source: Pitchbook as of December 31, 2025 unless otherwise stated.
16 Source: Pitchbook as of December 31, 2025 unless otherwise stated.
Private Credit
Private credit strategies have gained prominence over the last decade as banks and other financial institutions have scaled back their lending activity. Many institutional investors have significant allocations to private credit, taking advantage of higher yields and total returns, enjoying a premium to public markets and flexibility around portfolio construction with shorter fund lives than private equity. Private credit is more than just direct lending; other investment strategies include opportunistic/transitional capital, junior debt, and strategies focused on collateral outside of corporate credit, including asset-based lending. Borrowers include private companies and private equity sponsored companies, and the demand for capital continues to grow. As long-standing private credit investors, NEPC is focused on the themes below.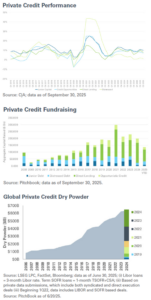
Market Anecdotes17
- Recent transactions in the upper middle-market underscore lenders’ continued willingness to underwrite multi‑billion‑dollar credits at mid‑400s to mid‑500s spreads, minimal amortization, and structural flexibility, even at elevated leverage. The persistence of portability features, step‑downs, and zero‑amortization profiles highlights the extent of competitive pressures—and borrower leverage—at the top end of the private credit market (Pitchbook 4Q25 Quarterly Wrap)
- Deal activity surged in the fourth quarter, but lenders still report under-deployment due to limited high-quality supply and heightened competition.18 This translates into tighter pricing (lower spread thresholds) and a higher tolerance of leverage.
- Recent commentary from the IMF and Moody’s points to rising interconnectedness between banks and private credit. The IMF has flagged the rapid expansion of non‑bank financial institutions as a driver of increasing concentration risk for certain U.S. and European banks, while Moody’s estimates that U.S. banks have extended roughly $300 billion of financing to private credit providers.
- Private credit secondaries fundraising continues to accelerate; one GP recently closed another private credit secondaries fund at $4 billion in commitments, exceeding the $2 billion initial target.
- Private credit secondary market deal activity continues to accelerate; examples include during the quarter Ares came to market with two continuation vehicles, each valued at $1 billion, while Stepstone brought one $1 billion vehicle to market. New Mountain Capital launched a $500 million GP-led deal to reduce the BDC’s exposure to PIK instruments .
- Industry consolidation continues: examples include CVC Capital acquired 100% of Marathon Asset Management; EQT bought the majority of Coller Capital.
- Semi-liquid funds continue to gain traction as wealth investors seek private credit exposure. Buyer beware, as this growth has been rapid: total AUM doubled from $245 billion (2022) to $500 billion (2025), and direct lending led the expansion from $63.3 billion (2022) to $209 billion (2025). The sharp influx of direct lending evergreen AUM intensifies pressure to deploy, and exacerbates mismatches in asset liquidity and investor redemption expectations.
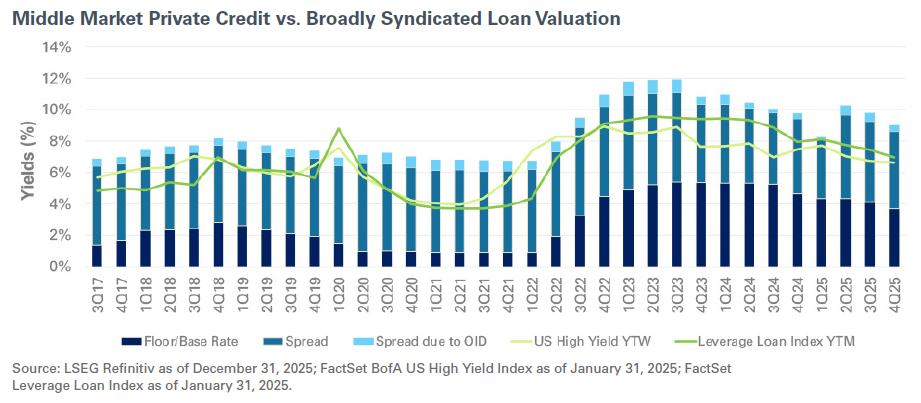
Performance19
- Yields tightened across market segments quarter-over-quarter; spreads continue to compress due to competition for high-quality deals across most segments.
- Base rates for floating-rate loans are tied to the secured overnight financing rate (SOFR), which stands at 3.50%–3.75% on the heels of the January 28, 2026, Federal Open Market Committee decision to keep its policy interest rate unchanged. Floating rate loans include first lien, unitranche and broadly syndicated loans (BSLs).
- First-lien middle-market direct-lending yields fell, driven by lower spreads and base rates.
- Average all-in yields for first-lien middle-market direct-lending deals tightened by 59 basis points to 9.16% in the fourth quarter.
- Average spreads on first-lien middle-market direct lending tightened modestly to 500 basis points in the fourth quarter.
- Average spreads on unitranche middle-market direct lending tightened to 508 basis points in the fourth quarter.
- The yield premium for direct lending deals compared to broadly syndicated middle-market loans tightened to 203 basis points in the fourth quarter; BSL spreads were at 384 basis points in the fourth quarter (slightly wider, by 27 basis points, quarter-over-quarter).
Fundraising
- Private credit fundraising in 2025 has remained resilient despite the broader slowdown across private markets.
- As of September 30, 2025, 125 traditional drawdown private debt funds held their final close in 2025, raising $154 billion in aggregate, per PitchBook data.
- Interval funds, tender offer funds, and BDCs are also experiencing massive inflows of retail capital as well as institutional and insurance capital. These inflows are not captured in the 125 funds and $154 billion raised through September 30, 2025 statistics.
- Investor capital is shifting towards more specialized strategies, including asset-backed finance (ABF) and fund finance (NAV loans, credit secondaries, GP structured solutions).
- Fundraising in private credit secondaries continues to accelerate, with platforms raising multiples of initial targets. One GP closed its first secondaries fund at $4 billion versus a $2 billion target, following $17 billion raised across four additional mega funds in 2025. The resulting influx of capital is intensifying deployment pressure and competition for large‑scale transactions.
Disclosures: Direct lending data comprises PitchBook’s direct lending, general debt and bridge financing data. Opportunistic credit consists of PitchBook’s opportunistic credit and venture debt data.
Deal Activity
- The fourth quarter marked a clear acceleration in direct lending activity, driven by renewed sponsor confidence and higher new money issuance.
- Fourth quarter activity reached $109 billion (up 19% quarter over quarter), with new-money financing totaling $78 billion; the surge was driven by new-money financings, not just refinancings.
- Sponsor activity dominated the quarter, particularly at the large-end of the market, with $72 billion of sponsor-backed volume in the fourth quarter (up 22% quarter over quarter).
- More broadly, activity across LBOs, add-on M&A, recapitalizations, and growth financings improved as well.
- Direct lenders captured roughly half of total LBO financings in the fourth quarter.
- Add-on M&A volume rose materially quarter over quarter, signaling re-acceleration of buy-and-build activity across sponsors.
- Recapitalization activity more than doubled relative to earlier quarters. The resurgence may support incremental sponsor liquidity and selective LP distributions.
- The fourth quarter was one of the strongest quarters of the year, helping push full-year US direct lending volumes to $380 billion.
- Full-year 2025 new-money issuance across U.S. direct lending reached $248 billion.
- Full-year 2025 sponsor U.S. direct lending volume was down marginally by 2% year over year.
- Sector activity was led by technology, business services, and healthcare.
Valuations
- According to LSEG LPC, leverage for direct lending and broadly syndicated loans ticked up in the fourth quarter but remains below 2024 levels. The direct lending market continues to support higher leverage levels than the broadly syndicated loan market.
- For direct lending, average leverage levels were at 4.65x in the fourth quarter (up from 4.54x in the third quarter).
- For BSL, average leverage levels were at 4.01x in the fourth quarter (up from 3.79x in the third quarter).
- The share across middle market sponsor-backed deals with average leverage above 5x increased slightly to 38% in the fourth quarter from 33% in the prior quarter.
- While LBO purchase price multiples increased in the fourth quarter, particularly in large-cap transactions, the rise was absorbed primarily through higher equity contributions rather than increased leverage, with middle-market LTVs remaining flat.
- Middle-market purchase price multiples rose from 11.16x in the third quarter to 11.34x in the fourth quarter.
- Equity contributions rose to 60.6% in the fourth quarter, up marginally from 60.2% in the third quarter and 59.2% in the fourth quarter, resulting in slightly larger equity cushions.
- Middle-market LTVs remained flat at 38%, consistent with both the prior quarter and year ago levels.
- Large-cap LBO purchase price multiples rose sharply from 11.15x in the third quarter to 14.93x in the fourth quarter, signaling sponsors’ willingness to pay up for high-quality assets.
 Exits
Exits
 Exits
Exits- There were 10 direct lending deals that were refinanced by broadly syndicated loans in the fourth quarter (eight of them were sponsor-backed) totaling $13 billion.
- The trailing 12-month default rate for leverage loans declined for a second consecutive month to 4.8% but remains historically high.
- Distressed exchanges dominate (two-thirds of defaults) not liquidation.
- Distressed and defaulting volume primarily comes from technology, healthcare, industries, and select consumer segments.
- Quality dispersion is widening – sub-80 loans expanded for the fifth straight month to ~7%.
- The expectation is that realizations should increase with an uptick in M&A and overall deal activity, including refinancings by the broadly syndicated loan markets, as they have become more active.
17 Pitchbook 4Q25 US Evergreen Fund Landscape
18 LSEG Middle Market 4Q25 Lender Outlook Survey.
19 SEG LPC, 4Q25 US Sponsored Market Private Deals Analysis (published January 2026). Data coverage Fourth quarter 2025 and full‑year 2025.
Real Estate
Private real estate can play multiple roles in a portfolio, ranging from more income-oriented core and core-plus strategies to total-return-seeking opportunistic approaches at the other end of the spectrum. In recent years, real estate has experienced swings in valuations driven by the rapid fall and rise in interest rates. As the market finds its footing, we observe general liquidity but many real estate investors continue to hold out for more favorable pricing which has slowed distributions to investors.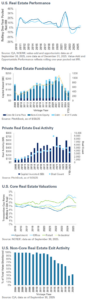
Market Anecdotes
- Real estate valuations, represented by transaction cap rates, continue to show signs of stability after years of uncertainty. Cap rates for apartment and industrial assets remain around 5%, while retail cap rates continue to compress.21
- The recovery in the office sector, meanwhile, remains slow and varied. Transaction cap rates for office space are still elevated relative to other property types, but are slowly decreasing. In a positive sign for the office sector, Manhattan office leasing activity in 2025 was the highest in six years and just 2.4% below 2019 levels, according to Colliers.22
- NEPC observes that new construction remains muted across property types, a dynamic which is expected to persist through 2026.23
- Both core and non-core real estate performance remains below long-term averages, and investor sentiment seems somewhat mixed. An annual survey conducted by Deloitte indicates that investors and industry participants are optimistic about commercial real estate fundamentals, similar to what was reported in 202524; however, Preqin reports that 30% of surveyed investors plan to reduce their commitments to real estate in the next year, versus 27% planning to increase.25
Performance
- The recovery in core real estate (as represented by the NFI-ODCE Index) returns flattened out in the second half of 2025, with the Index posting negative appreciation for the second straight quarter for the three months ended December 31. The total net return for the fourth quarter was a slight improvement, at 0.68% (preliminary) vs. 0.52% for the third quarter.
- For the year ending December 31, the ODCE generated slightly negative (-0.31%) appreciation and a preliminary 2.90% total net return for the year.26
- The universe of U.S. value-add and opportunistic real estate funds are also reporting underwhelming returns so far for 2025, with rolling one-year returns unable to turn positive as of September 30 (the most recently available data). While these strategies have lagged core real estate in 2025, it should be noted that they also did not dip as negatively in the prior years.
Fundraising
- Real estate managers saw continued momentum in fundraising activity in the third quarter, according to data from PitchBook.
- Non-core equity funds (including value-add and opportunistic strategies) reported a total of just over $72 billion in capital raised for the year through September 30. This puts 2025 on a track to potentially exceed the total raised in 2024, though the pace remains well below the levels seen in prior years.
- Real estate debt strategies continue to attract capital, but similar to last quarter, the pace of capital raising seems to have slowed relative to 2024. Year-to-date, debt funds have raised just over $16 billion in 2025, on pace to raise about $20 billion for the year.
- Overall commitment volumes continue to be hampered by a slow return of capital from older vintage funds.
Deal Activity
- There is liquidity in the market as acquisition activity from private funds continues to recover from cyclical lows experienced over the past two years.
- According to data from PitchBook, private real estate deal volumes (in dollar terms) have eclipsed the totals for 2023 and 2024, though the overall number of transactions is still slightly lower.
- Altus Group’s latest report on commercial real estate transactions tells a similar story, with 2025 transaction volumes slightly ahead of the pace 2024 set, but well below the volumes seen in 2022 and prior years.27
- Still, while transaction activity has rebounded from the low point, they remain well below pre-pandemic levels, and actual values vary significantly by property type.
Valuations
- Transaction cap rates, or “going-in yields,” for apartments and industrial assets remain stable, right around 5%.
- Cap rates for retail properties continue to fall – rolling one-year average transaction cap rates have fallen from over 7.6% in mid-2024 to under 5.9% at the end of the third quarter of 2025.
- Office properties continue to observe the highest cap rates of the “traditional” four property types. While the office sector also saw transaction cap rates come down in the third quarter, they remain almost 140 basis points higher than retail at about 7.25%.
Exits
- Closed-end real estate funds showed little change in distribution amounts during the third quarter,aggregate distribution-to-paid-in (DPI) multiples below 1.0x for 2017 and all subsequent vintage years.
- Stabilizing property values and continued improvements in market liquidity should (hopefully) help support a healthier exit environment in 2026.
21 Source: NCREIF as of September 30, 2025.
22 https://www.cnbc.com/2026/01/06/manhattan-q4-office-leasing-rebound.html
23 https://www.jll.com/en-us/insights/market-outlook/global-real-estate
24https://www.deloitte.com/us/en/insights/industry/financial-services/financial-services-industry-outlooks/commercial-real-estate-outlook.html
25 https://www.blackrock.com/aladdin/discover/press-release-preqins-global-reports-private-markets-trends-2025
26 Source: NCREIF as of December 31, 2025.
27 Altus Group as of September 30, 2025. https://www.altusgroup.com/featured-insights/cre-transactions/
Real Assets
Real assets represent a broad array of underlying asset classes and sectors, including hard assets, for instance, infrastructure, and natural resources such as energy private equity. Real assets exhibit differentiated returns relative to other asset classes, offering potential diversification benefits for investors. Many real asset investments include a current income component, the potential for capital appreciation, and a partial hedge against inflation. In recent years, infrastructure has received a lot of attention from investors, resulting in the rapid growth and evolution of the infrastructure investment landscape.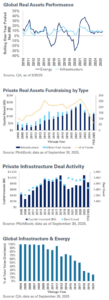
Market Anecdotes
- Infrastructure continues to attract substantial private capital, with nearly all of the capital focused on North America and Europe. According to a report published by Preqin, infrastructure’s capital raising momentum is likely to continue, as 40% of surveyed investors plan to increase commitments to the asset class in the next 12 months.28
- As large technology companies continue to announce large scale capital expenditure projects for data centers, investor focus within real assets is increasingly on power generation and related infrastructure. JLL reports that global data center capacity is expected to double by 2030, representing another 100 gigawatts of power required.29
- While nuclear power plants have garnered some headlines, NEPC observes that these investments tend to require multiple billions of dollars invested over several years, which has generally limited private investment in the sector.
Performance
- Both energy private equity and infrastructure funds have generated consistent returns in the high single digits (on a rolling one-year basis) for the past several quarters through September 30, 2025.
- Returns for closed-end infrastructure funds have moderated from the historically high levels seen in 2021, but continue to exhibit impressive stability with rolling one-year returns above 6% for all but two quarters in the past 10 years.30
- Private equity energy strategies also seem to have stabilized after years of high volatility seen leading up to and immediately after 2020, and in aggregate are up just under 9% for the trailing one-year period ended September 30.30
Fundraising
- Fundraising for infrastructure and energy private equity strategies slowed a bit in the third quarter, but maintains an overall healthy pace for the year.
- Infrastructure funds have raised a total of just over $115 billion year-to-date, already exceeding the total for 2024.
- Capital raising remains focused on North America and Europe, with just over 3% raised outside of these two regions according to data from PitchBook.
Deal Activity
- Infrastructure deal volumes totaled nearly $850 billion through the first three quarters of 2025, remaining on pace to possibly exceed the all-time high observed in 2024, according to data from PitchBook.
- As core and core-plus infrastructure funds grow in size, mega funds continue to seek scale by making large platform acquisitions.
- Notable transactions during the fourth quarter included the $6.3 billion acquisition of ALLETE, Inc., a public utility company based in Minnesota acquired by Global Infrastructure Partners (a subsidiary of BlackRock) and CPPIB (a Canadian pension).31
Valuations
- Valuation multiples (EV/ EBITDA) for infrastructure transactions are stable, according to a report published by DWS in January 2026. According to DWS’s data, multiples have “risen slightly” from mid-year through to the end of 2025.32
- NEPC observes that digital infrastructure continues to attract investor capital, and the power sector has seen renewed interest, causing some to express concern over valuations should competition for deals increase.
Exits
- Distribution rates for global infrastructure and energy strategies were largely unchanged during the third quarter.
- NEPC observes that continuation vehicles are gaining traction as a means for generating liquidity for energy private equity strategies as well as infrastructure.
For questions on your private markets portfolio, or to discuss current market trends and opportunities, please reach out to your NEPC consultant.
28 https://www.blackrock.com/aladdin/discover/press-release-preqins-global-reports-private-markets-trends-2025
29 https://www.jll.com/en-us/insights/market-outlook/data-center-outlook
30 Source: C|A, as of 9/30/25
31 https://www.businesswire.com/news/home/20251215651998/en/ALLETE-Announces-Completion-of-Acquisition-by-CPP-Investments-
and-Global-Infrastructure-Partnershttps://www.utilitydive.com/news/minnesota-puc-allete-private-equity-blackrock-gip/802006/
32 https://www.dws.com/en-us/insights/alternatives-
For questions on your private markets portfolio, or to discuss current market trends and opportunities, please reach out to your NEPC consultant.