Private market investments are making up an increasingly larger share of institutional and individual investor portfolios. Private market investments can generate a return premium to public markets but require tradeoffs in liquidity, fees and complexity. In this quarterly report, NEPC’s investment team outlines our views on private markets. As always, we remain committed to help our clients successfully run private market investment programs in the face of uncertainty and change.
Private markets strategies today exhibit many common themes:
- Liquidity: slower exit activity has inspired general partners (GPs) to get creative with historically non traditional exit options becoming mainstream. Continuation vehicles (and second continuation vehicles!), secondary sales and credit restructurings are major liquidity levers for GPs now. For limited partners (LPs), leaning on secondary sales as viable (and destigmatized) portfolio management tools has become common. As commitment pacing planning season kicks off, many LPs question the validity of
historical assumptions for the growth rates and fund lives of private market strategies. - Flight-to-quality: in the context of fundraising, deal-making and exits, bigger GPs and large deals are driving activity across private equity, private debt and real estate/assets. As a result, this segment is more competitive as LPs and GPs alike seek quality. We see opportunities in smaller funds and deal across credit, equity and real assets.
- Artificial intelligence: this investment theme is now woven into many private market strategies, from venture capital to buyouts to real estate and infrastructure. AI valuations continue to march higher, and we are careful to parse quality AI investments from those swept up in the market’s enthusiasm.
- Rise of wealth: individual investors are increasingly seeking private markets exposure in their portfolios via rapidly expanding semi-liquid vehicles. Morningstar issued its inaugural ratings of semi-liquid funds in September 2025, further cementing the theme of public and private market convergence.
- Industry consolidation: consolidation is a classic sign of a mature industry. Many consolidation deals have been done under the banner of democratizing private markets (alternatives offerings grow a company’s multiple) or to inject liquidity into a GP for succession management or expansion. Examples include Goldman Sachs’ acquisition of Industry Ventures and Blackrock’s acquisitions of Global Infrastructure Partners and HPS private credit.
Buyouts
Buyouts are a core part of many investors’ private markets portfolios. Returns remain strong over the long term but have slowed (along with deal activity) in recent years due to market volatility, limited IPO exits, higher rates, a valuation disconnect between buyers and sellers, and uncertainty regarding the future economic and regulatory environment. High-quality assets are trading hands, while lower- quality ones are taking more time to exit. Prolonged slower-than-expected distributions may constrain liquidity for some investors, as a result, and we recommend clients conduct a liquidity study to understand their illiquidity risk.
NEPC’s buyout team is focused on the smaller end of the market, which offers higher growth opportunities and wider exit opportunities. We believe periods of uncertainty, such as this, can be excellent opportunities to deploy new capital in private markets.
Market Anecdotes
- As of September 29, 2025, Electronic Arts (EA) entered into a definitive agreement to be acquired in an all-cash transaction valuing EA at an enterprise value of approximately $55 billion, marking the largest leveraged buyout of all time.
- Currently, a potential emerging trend involves sponsors executing a second continuation fund for the same portfolio company. Notably, Accel-KKR recently raised $1.9 billion to transition its iSolved investment into a second continuation vehicle, following an initial $1.4 billion continuation fund deal completed in 2019.
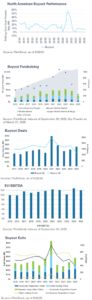
Performance
- Performance has strengthened after bottoming out in 2022.
- The lack of distributions points to the fact that most of the performance is attributable to unrealized (paper) gains rather than realized capital gains returned to LPs.
Fundraising
- The trend of sluggish fundraising continued through the third quarter of 2025, primarily driven by limited partners adopting a more cautious approach to capital deployment. This shift is largely due to a slowdown in distributions, which has constrained their ability to recycle capital into new commitments.
- U.S. buyout fundraising is down 41% from 2024 in total dollars raised and 57% in terms of number of funds. U.S. buyout funds raised $214 billion thus far in 2025, down from $360 billion in 2024.
- 49% of total capital raised in 2025 has been allocated to larger funds.
Deal Activity
- Deal activity in 2025 continues to rebound, with value increasing 17% year-over-year, from $384 billion in 2024 to $451 billion so far this year.
- Drivers: Risk projections around a recession remain low; the Fed’s modest rate cuts combined with public markets hitting record highs are fueling a risk-on appetite, according to PitchBook.
- Over the past three years, deal leverage has remained relatively stable at roughly 5x debt-to-EBITDA. As markets reopened, there was a notable and higher-than-average increase in debt repricing activity beginning in the first quarter of 2024 and continuing through the third quarter of 2025.
- Year-to-date, 3,300 smaller bolt-on acquisitions have been completed, compared to 4,908 in 2024, according to PitchBook.
- Continuation vehicles (CVs) remain a source of liquidity for limited partners when needed, and a strategic tool for general partners seeking to hold onto assets longer. Year-to-date, there have been 105 sales to CVs – a trend we expect to continue through 2025 and into 2026.
Valuations
- Valuations have increased relative to 2023—rising to 12.0x from 10.2x—signaling that high-quality deals are continuing despite ongoing market uncertainty. However, this marks a decline from 12.8x observed in 2024.
- Valuations are expected to decline in late 2025 and into 2026 as balance sheets come under pressure and lower-quality deals come to market.
Exits
- Year-to-date U.S. private equity exit activity has already surpassed 2024, with total exit value reaching $472 billion compared to $377 billion last year. However, the number of exits is down, suggesting that quality is still driving transactions.
- Median holding periods for U.S. private equity–backed companies have declined from their 2023 peak of seven years, according to PitchBook The current median has dropped to six years, reflecting improved exit activity, though it still exceeds the pre-pandemic average of 5.2 years.
- With valuations rising and transaction volume still subdued, the highest-quality assets appear to trade hands. The real test will come when bid-ask spreads begin to narrow for lower-tier assets. Notably, mega-exits account for 77% of year-to-date exit value.
Venture Capital
Venture capital can provide return enhancement to investment programs, but manager selection is paramount. The IPO market has reopened, but access remains limited to top-tier companies. Although up from 2024, substantial exits remain scarce, putting strain on over-allocated portfolios. This has also contributed to a slowdown in overall fundraising. Assuming no major economic disruptions, there are signs that distributions may begin to pick up towards the end of 2025 year and early next year, considering the backlog of IPO-ready companies.
AI has dominated the narrative across the industry, with many managers crowding this space to gain exposure. We anticipate that valuations for non-AI companies with weaker earnings will begin to come under pressure. This will likely result in performance degradation among lower-quality firms, leading to a wider dispersion of returns. 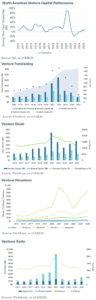
Market Anecdotes*
- OpenAI conducts a $6.4 billion secondary tender at a $500 billion valuation, up from $300 billion post money value, in their primary financing in March 2025.
- OpenAI spends $6.5 billion on an all-stock deal to acquire Jony Ive’s io Products in pursuit of physical world applications for AI.
- Windsurf was acquired by Google at a $2.4 billion valuation. Google received a license for technology and took the senior team.
- Anthropic raised $13 billion at $183 billion post-money valuation.
- Industry Ventures acquired by Goldman Sachs in a $965 million deal. This deal occurs at a time when we are seeing a quasi-liquid market for the top private companies and significantly dedicated capital flowing into the VC secondary space. This follows the acquisition of Greenspring Associates by StepStone in 2021, and the spin-in of the former SVB Capital infrastructure into Pinegrove, a joint venture between Brookfield and Sequoia. In addition to the acquisition of these dedicated VC secondary platforms, we are seeing larger secondary players like Lexington dedicate significant capital (although still a small percentage of its funds) into this space.
*Source: https://www.cnbc.com/2025/10/02/openai-share-sale-500-billion-valuation.html
Performance
- Performance has strengthened after bottoming out in 2022. AI companies remain key drivers of performance.
- The lack of distributions underscores the fact that most of the performance is attributable to unrealized (paper) gains rather than realized capital gains returned to LPs.
Fundraising
- The trend of sluggish fundraising continued through the third quarter of 2025, primarily driven by limited partners adopting a more cautious approach to capital deployment. This shift is largely due to a slowdown in distributions, which has constrained their ability to recycle capital into new commitments.
- In the first nine months of 2025, $45 billion was raised across 376 funds—significantly down from the peak in in 2022, according to PitchBook data as of September 30, 2025.
- After a period of stabilization in 2024, levels of dry powder have begun to rise again in 2025, signaling renewed availability of capital across the venture landscape. This increase is partly driven by the substantial capital raised in 2022 and 2023 that remains undeployed. Moreover, despite a slowdown in overall fundraising activity in 2024 and 2025, capital formation continues, and leading platforms are still able to attract significant commitments. This momentum is expected to persist until earlier vintage funds begin deploying capital more actively.
Deal Activity
- Dry powder dedicated to VC secondaries has nearly doubled from its prior peak in 2021, going from $4.7 billion to $8.2 billion as of December 31, 2024, plus $10.3 billion in unrealized NAV, according to PitchBook’s Venture Secondary report from the second quarter of 2025.
- Venture capital firms deployed $80.9 billion across approximately 4,200 deals in the third quarter of 2025, according to PitchBook Overall deal activity is down from 2022 levels but remains ahead of the 2014–2017 period. In the first nine months of 2025, 10,616 deals were completed, compared to the peak in 2021 of 19,648.
- Deal value through the first three quarters of 2025 remains strong. However, the number of completed deals continues to decline, suggesting a perceived flight to quality. This trend appears to be driven largely by heightened enthusiasm around AI and a fear of missing out.
Valuations
- Valuations in 2025 are gradually increasing across all stages, likely driven by high-quality and AI-related companies.
- Year-to-date, valuations in the AI and machine learning sector have dominated, accounting for 64% of total venture deal value.
- Later-stage rounds are approaching record valuations, with Series C rounds now surpassing 2021 levels, which previously peaked at a median pre-money valuation of $282 million.
Exits
- So far this year, venture is on track to record the highest exit value since 2021. Interestingly, 75% of acquisitions during this period occurred at or before the Series A stage.
- The IPO market has reopened, but access remains limited to top-tier companies. Many of these listings have priced at a meaningful discount relative to their peak private financing rounds in 2021. Notable IPOs in the third quarter of 2025 included Figma and Firefly.
- Through the third quarter of 2025, only eight pharmaceutical and biotech companies have gone public, marking a sharp decline compared to 22 biotech IPOs in 2024, according to PitchBook, which was already significantly below the decade average of 39.
Private Credit
Private credit strategies have gained prominence over the last decade as banks and other financial institutions have stepped back their lending activity. Many institutional investors have significant allocations to private credit, taking advantage of higher yields and total returns, enjoying a premium to public markets and flexibility around portfolio construction with shorter fund lives than private equity. Private credit is more than just direct lending; other investment strategies include opportunistic/transitional capital, junior debt and strategies focused on collateral outside of corporate credit including asset-based lending. Borrowers include private companies and private equity sponsored companies, and the demand for capital continues to grow. As long-standing private credit investors, NEPC is focused on the themes below. 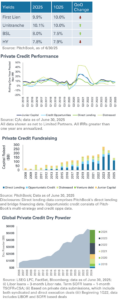
Market Anecdotes
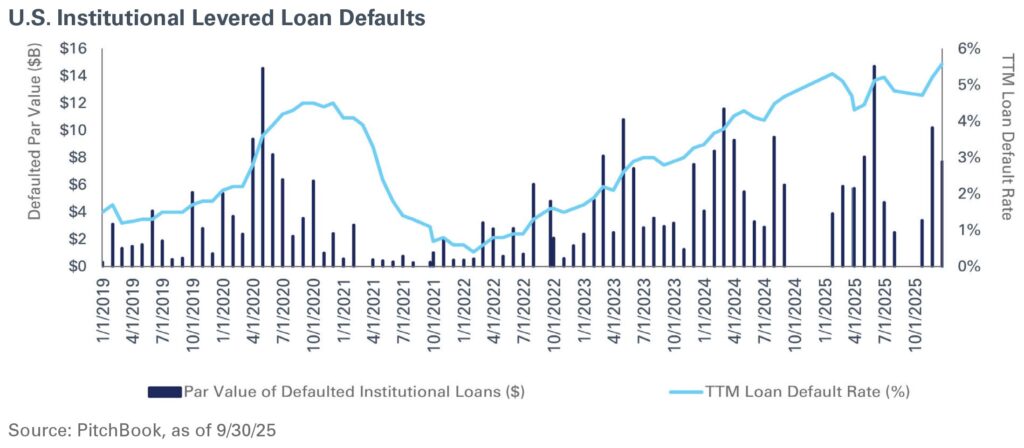
- Two major defaults occurred in 2Q25: At Home (retail) and Marelli (automotive), both already facing declining performance before tariffs accelerated negative trends. Lenders took ownership of both company’s post-default. In September 2025, First Brands (auto parts supplier) filed for bankruptcy, raising concerns around the health of specific industries.
- Quarterly deal activity was driven by a few mega deals, including Clearlake’s take-private transaction of Dun & Bradstreet ($5.5 billion) and Thoma Bravo’s Boeing asset acquisition ($4 billion unitranche).
- Mid-October 2025, BioCryst Pharmaceuticals (Nasdaq: BCRX) turned to the direct lending market to finance acquisition of Astria Therapeutics (Nasdaq: ATXS) via a $550 million credit facility.
- Industry consolidation continues: Manulife acquired Comvest Credit Partners (North American direct lender); Benefit Street Partners acquired Apera (European direct lender); Rithm acquired Crestline Investors,
- Semi-liquid funds are growing as wealth investors seek private credit exposure. Approximately two-thirds of interval funds are credit-oriented. Buyers beware, however, as some semi-liquid credit funds have meaningful exposure to public credit.
Performance
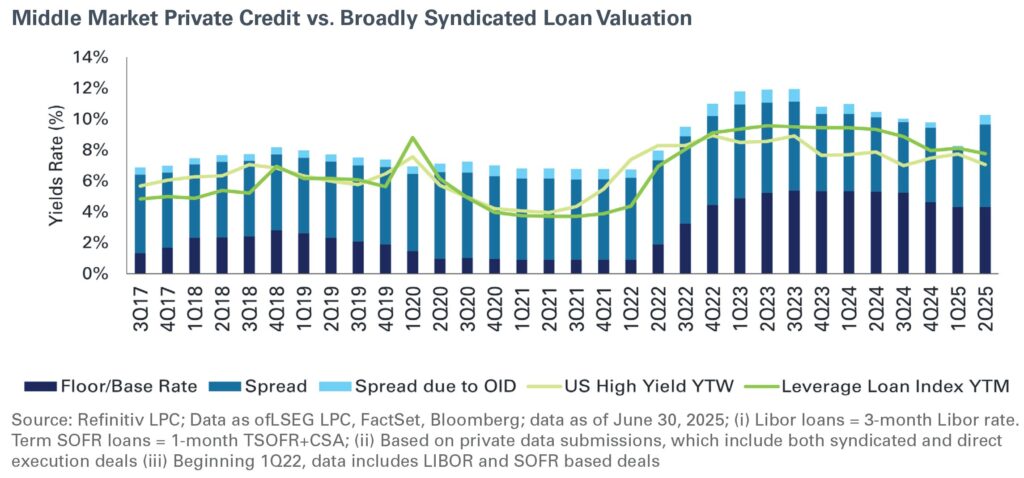
- The direction of yields varied across market segments quarter-over-quarter; spreads continue to compress due to competition for high-quality deals but vary by market segment.
- Base rates for floating-rate loans are tied to the secured overnight financing rate (SOFR), which stands at 4.0%–4.25% on the heels of the September 17, Federal Open Market Committee rate of 25 basis points. Floating rate loans include including first lien, unitranche and bank syndicated loans (BSLs).
- Spreads have compressed in direct lending but still offer a premium over public fixed income; according to Pitchbook, BSL spreads are at 351 basis points YTD 2025, according to PitchBook.
- Larger borrowers can get sub-500 basis points spreads; in the third quarter of 2025, 57% of sponsor-backed direct lending deals were done at sub-500 basis points spreads (increase from prior peak of 38% in the second quarter). The average all-in yield premium on middle- market direct lending deals compared to large corporates widened to 232 basis points, according to LSEG LPC.*
*Source: LSEG LPC; as of September 30, 2025.
Fundraising
- Private Credit fundraising surpassed $100 billion in the first half of 2025.
- Distressed fundraising rose, surpassing full-year 2024 volumes as investors responded to changing market conditions and concerns around the liquidity of borrowers
- Junior capital fundraising dropped sharply to $6.1 billion in 2024 (a record low) from $41.9 billion in 2023 (a record high) amid continuing volatility across this strategy type; 2025 YTD stands at $4.2 billion.
- Fundraising in private credit secondaries has surged, with platforms like Pantheon, Coller, and 17 Capital raising multiples of their initial targets. For example, one GP sought to raise $1.5 billion but received over $5 billion in LP demand. Global platforms such as Carlyle, Ares, and Apollo have also set up dedicated private credit secondaries funds, highlighting growing competition in the market.
- Business development companies (BDCs) provide real-time visibility into the U.S. direct lending market because valuations are marked-to-market.
- BDC AUM grew by $28 billion quarter-over-quarter to a peak of $503 billion in the second quarter of 2025, signaling strong technicals across the US sponsor-backed upper middle market.
- Notably, in the third quarter of 2025, TPG Twin Brook Capital Partners and Coller Capital closed on a $3 billion continuation vehicle, the largest CV in private credit secondaries market history.
Deal Activity
- Uncertainty post Liberation Day led to subdued M&A activity.
- For 15 consecutive days in the second quarter of 2025, no new BSL transactions were issued in the U.S. This was the longest period of inactivity since early 2020.
- Limited BSL activity allows direct lenders to fill the financing gap/void at that end of the market.
- More broadly, the BSL market is open/active. According to PitchBook data through September 30, 2025, 36% of buyouts over $1 billion were financed by the direct lending market, while 54% were financed by the BSL market.
- Although direct lending add-ons and dividend recaps are down on a YTD basis, add-on acquisition loan volume increased by 7% in the third quarter.
- Private credit technicals remain strong, with $542.7 billion in global dry powder and more than $100 billion raised in the first half of 2025.* This signals an increase in competitive pressure and potential yield compression within private credit markets.
*Source: LSEG LPC, FactSet, Bloomberg data as of June 30, 2025.
Valuations
- According to LSEG LPC as of September 30, 2025, large. buyouts saw average overall leverage levels, across both broadly syndicated loans and direct lending, decrease in the third quarter to sub-6.0x debt-to-EBITDA level; middle market buyouts also saw a decrease in average leverage levels to sub-4.5x debt-to-EBITDA.
- Most BDCs saw their portfolio values fall in the second quarter of 2025 because fair value marks declined from the prior quarter, indicating softening market conditions.
- BDC deal-level leverage is in line with recent norms.
- First-lien leverage levels are at 3.7x in the second quarter (slight increase year-over-year (3.6x)).
- Unitranche leverage levels are at 5.5x in the second quarter (slight increase year-over-year
(5.4x)).
- Across BDCs, PIK (payment-in-kind) usage is elevated relative to the second quarter of 2024 but has come down from its recent peak in the fourth quarter of 2024.
- 12% of BDCs show payment-in-kind (PIK) income (as a % of total investment income) above 10%.
- This is down from 17.5% in the first quarter of 2025 and 23% in the fourth quarter of 2024 (peak).
- On average, PIK income came in at 6.3% across all BDCs, underscoring investors’ sentiment of liquidity issues/*stress in the market.
- 12% of BDCs show payment-in-kind (PIK) income (as a % of total investment income) above 10%.
*Source: LSEG LPC; report as of August 21, 2025, and databased on universe of BDCs financial results as of August 18, 2025.
Exits
- Exit activity has slowed, but distributions, in the form of current income/ coupon, continue to be healthy.
- According to S&P Global, in the first quarter of 2025, 47% of high yield/ levered loan issuers are cash flow negative and will face refinancing challenges. This is down from the most recent peak in the second quarter of 2022 (59%).
Real Estate
Private real estate can play multiple roles in a portfolio, ranging from more income-oriented core and core-plus strategies to total-return-seeking opportunistic approaches at the other end of the spectrum. From 2022 through 2024, we have observed real estate experience swings in valuations driven by the rapid fall and rise in interest rates. As the market finds its footing, we observe general liquidity but many real estate investors continue to hold out for more favorable pricing which has slowed distributions to investors. 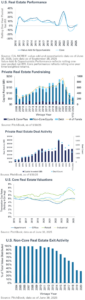
Market Anecdotes
- After a multi-year downturn, real estate values in the U.S. stabilized in 2024, per the U.S. Real Estate Performance chart below. They continue to show signs of a slow recovery through 2025, but their path varies by market and property types.
- The office market continues to be a drag on the overall commercial real estate sector, with vacancy rates slowly ticking higher; some investors are returning, for instance, in August, RXR Realty closed on its $1.1 billion acquisition of 590 Madison Avenue, the largest NYC office transaction since 2018.*
- We believe limited new construction provides a favorable supply/ demand dynamic across property types.
- In our opinion, tariffs are adding some uncertainty into the market, though their full impact remains to be seen; some markets (such as west coast industrial) have shown some signs of softening.
*Source: https://www.costar.com/article/1330143275/rxr-buys-former-ibm-building-in-new-york-for-1-08-billion
Performance
- 2015-2019 vintage funds returns were dampened by impact of the Covid pandemic but returns vary widely by property type.
- Core real estate (as represented by the NFIODCE Index) took a step back in the third quarter, posting a preliminary 0.52% net return (vs. 0.81% in the prior quarter) along with negative asset appreciation after being roughly flat for several quarters. While we await final data, it seems that this may be, in part, due to bifurcation within the market, with some core funds experiencing asset write-downs while others continue to post positive returns.
- The rolling one-year returns continue to trend higher, despite the setback in the third quarter, as the index digs out of a multi-year downturn.
- Value-add and opportunistic real estate returns remain flat on a rolling one-year basis.
Fundraising
- Real estate managers saw an uptick in capital-raising activity in the second quarter, building on what had been a slow start to the year.
- Non-core equity funds (including value-add and opportunistic strategies) reported a total of just under $55 billion in capital raised for the year through June 30. While this pace is still well below the levels of fundraising seen from the second half of the 2010s through 2022, it does put 2025 on track to potentially exceed 2024 (which saw a total of just over $77 billion raised).
- Real estate debt strategies also continue to attract capital, though the second quarter did experience a modest slowdown. Year-to-date, debt funds have raised nearly $13 billion, roughly on pace for the $20 billion to $25 billion raised each of the prior two calendar years.
- We believe overall commitment volumes continue to be hampered by a slow return of capital from older vintage funds.
Deal Activity
- There is liquidity in the market as acquisition activity from private funds continues to recover from cyclical lows experienced over the past two years.
- According to data from PitchBook, private real estate deal volumes (in dollar terms) have eclipsed the totals for 2023 and 2024, though the overall number of transactions is still slightly lower.
- While transaction volumes continue to increase year-over-year, they remain well below pre-pandemic levels, and actual values vary significantly by property type.
Valuations
- Transaction cap rates, or “going-in yields,” for apartments and industrial assets appear stable.
- Apartment cap rates are just above 5%, while industrial remains the only property type with recent transaction cap rates below 5%.
- Cap rates for retail properties continue to fall – rolling one-year average transaction cap rates are down to nearly 6% after peaking at over 7.5% in 2024.
- The office market remains challenging, as buyers and sellers (and lenders) try to determine appropriate values given the shift in office demand. Per NCREIF, transaction cap rates for offices ticked up in the second quarter to roughly 7.5%.
Exits
- While transaction markets have recovered from lows, fund managers are still slow to bring assets to the market as they hold out for higher pricing, which has led to a slower pace of distributions for older vintage closed-end funds.
- We believe a clearer path for interest rates and greater stability in asset values should help support a healthier exit environment as we head into 2026.
Real Assets
Real assets represent a broad array of underlying asset classes and sectors, including hard assets, for instance, infrastructure, and natural resources such as energy private equity. Real assets exhibit differentiated returns relative to other asset classes, offering potential diversification benefits for investors. Many real asset investments include a current income component, the potential for capital appreciation, and a partial hedge against inflation. In recent years, we have observed infrastructure receive a lot of attention from investors. We believe this has contributed to the rapid growth and evolution of the infrastructure investment landscape. 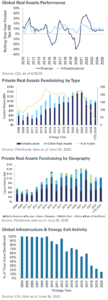
Market Anecdotes
- Infrastructure continues to attract substantial private capital, with digital and power generation themes capturing the most attention from investors.
- The International Energy Agency forecasts that global power demand from data centers is expected to more than double by 2030, which we believe will require significant capital investment into power generation and related infrastructure.*
- The need for additional power generation and the falling costs of production provide tailwinds for renewable power; however, uncertainty around tariffs and changing policies from Washington have caused concern among investors.
- Natural resource strategies have not seen the same fundraising success as the infrastructure sector, though rising metals prices may increase focus on mining strategies and relative stability in energy commodities should provide a supportive backdrop for private investment.
*Source: https://www.iea.org/news/ai-is-set-to-drive-surging-electricity-demand-from-data-centres-while-offering-the-potential-totransform-how-the-energy-sector-works (IEA, April 2025)
Performance
- Private equity energy strategies have seen stable performance in recent years, benefitting from a more sturdy environment for commodity prices and healthier balance sheets. Following multiple periods of extreme volatility, the rolling one-year return for energy private equity has ranged from 6% to 9% since the first quarter of 2023.
- Infrastructure funds have historically shown more stability, and in recent years have outperformed energy.
Fundraising
- Infrastructure fundraising continued at a solid pace in the second quarter, with total capital raised through the first half of the year already exceeding the total from 2024 (and on pace to challenge the all-time high in 2022).
- Most of this capital was raised in North America, with the YTD total for North America now about even with Europe.
- Aside from infrastructure, other real asset strategies raised an incremental $6.5 billion in the second quarter, bringing the total to just over $9 billion in the first half of the year.
Deal Activity
- Infrastructure transaction volumes continued at a rapid pace and are on track for the highest year on record, with over $1 trillion of transactions reported year-to-date, according to data from PitchBook.
- As core and core-plus infrastructure funds grow in size, mega funds continue to seek scale by making large platform acquisitions.
- In September, KKR announced a $10 billion deal for a controlling stake in Sempra, an energy infrastructure platform.
Valuations
- Valuation multiples (EV/ EBITDA) have been coming down in recent years as higher interest rates are met with large inflows of capital, according to UBS data as of September 30, 2025.
- Digital infrastructure assets have consistently attracted the highest valuations (on an EV/ EBITDA basis) compared to other sub-sectors such as energy, transportation, and water/waste.
- Investor capital returning to private energy markets has provided support for valuations in the sector, but entry yields remain relatively high, with managers reporting mid-teens cash yields on new acquisitions.
Exits
- In the second quarter, 2016 through 2019 vintage funds saw the biggest increase in distribution rates, suggesting the possibility of a fund’s lifecycle normalizing, though it is too early to draw any conclusions as hold periods for investments remain extended.
- Launches of continuation vehicle in the energy private equity sector continued during the quarter as well.
For questions on your private markets portfolio, or to discuss current market trends and opportunities, please reach out to your NEPC consultant.