Quick Answer:
We believe a community foundation’s spending policy works best when it is treated as a governance decision, not a fixed formula. While traditional fixed-rate spending policies are easy to implement and explain, they often have unintended consequences that can impact the foundation’s finances and credibility. Boards can benefit from evaluating a range of more resilient policies, including smoothing or hybrid approaches. By basing annual distributions on multiple years of asset values, adjusting prior spending or inflation, or applying predetermined floors and ceilings, these approaches can reduce abrupt changes in grantmaking while helping protect the portfolio’s long-term purchasing power.
For community foundation boards, spending policy is a challenging and potentially highly consequential governance decision. A well-designed policy can strengthen mission delivery, provide greater consistency for grantees and reinforce confidence among donors and the community. A policy that is poorly aligned with a foundation’s resources or obligations can instead create difficult tradeoffs between current distributions and long-term sustainability. A good spending policy therefore must account for evolving variables, including community need, investment strategy, fundraising, inflation and economic conditions.
Given these uncertainties, the instinct is to simplify by adopting a flat percentage of assets. That simplicity is appealing, but in our experience, the formula alone does not determine whether spending will remain sustainable or predictable. Working with community foundation clients, NEPC has recommended alternative ways to manage the complexity of spending policy, so foundations can meet today’s needs without compromising tomorrow’s.
Why Fixed Formulas Struggle in The Real World
In this paper, an asset-based policy refers to applying a fixed spending rate to the foundation’s most recent market value. For example, a 5% policy applied to a $250 million portfolio would authorize a $12.5 million distribution. If the portfolio’s market value rises or falls, the following year’s distribution changes with it.
A rolling-average policy may use the same 5% headline rate, but applies it to the average market value over a trailing period, commonly 12 or 20 quarters in our experience. Because a single strong or weak market year represents only part of the calculation, we see changes in annual spending generally occur more gradually.
We’ve seen asset-based spending policies function best when there is a level of predictability – something community foundations rarely have. In addition to market and economic variability, these institutions often face episodic surges in grant demand. They must balance near-term grantmaking with intergenerational equity, respect the requirements of both donor-advised and unrestricted funds, and manage payout expectations derived from legal obligations (such as minimum distribution requirements) or reputational expectations (such as donor demands or demonstrated community need).
Asset-based spending policies may be simple to implement and communicate, but they do not always reflect the operating realities faced by community foundations. Because annual spending is tied directly to current market value, distributions can rise quickly following strong markets and contract after periods of weakness. For organizations seeking predictable grantmaking, that variability can create difficult tradeoffs between meeting current community needs and preserving long-term financial sustainability.
Importantly, the current market value formula does not appear to be the prevailing methodology among community foundations in the 2025 Council on Foundations/Commonfund study1, 75% of participating community foundations report spending policy as a percentage of a moving average. Among community foundations with assets between $101 million and $500 million, the figure was 84%. This provides useful context for why rolling average methodologies should be treated as a central industry practice, rather than simply an alternative to current market value formula.
Year-to-Year Tweaking vs. Durable and Adaptable Policies
Faced with these pressures, we’ve seen many foundations end up tweaking spending policy on an ad hoc basis. It’s relatively common to see foundations temporarily increase grants during heightened community need, or to consider reducing them after a difficult market year. In the short term, these adjustments make the foundation more responsive. But over the long term they may raise real governance concerns, because they undermine policy discipline during periods of stress, when arguably discipline is most needed – and when community need is greatest.
NEPC has made it a priority to help foundation boards implement more durable and adaptable approaches. In our experience, many boards devote significant time to debating whether a foundation should spend 4.5%, 5.0%, or 5.5%, while spending less time evaluating the variables that ultimately determine spending sustainability. As a result, spending policy is often most effective when viewed through a Total Enterprise Management lens rather than solely as a distribution formula.
The 2025 Council on Foundations/Commonfund study reported an average stated spending policy rate of 4.6% for community foundations, unchanged from 2025, with relatively consistent rates across asset-size cohorts. It also found that 94% of community foundations distributed in accordance with their established guidelines. These findings reinforce that the more consequential governance questions often concern the policy’s structure, underlying assumptions, and organizational fit, rather than small differences in the headline rate alone.
We advise spending policies built around a range of financial factors, including portfolio structure and asset mix; smoothing mechanisms and guardrails; alignment between liquidity and cash flow; and the organization’s enterprise-level risk tolerance.
In our experience, these factors can be applied in one of two ways:
• Rolling average, or smoothing, policies apply a spend rate, typically 4–5%, to asset value averages over a multi-year trailing period, commonly 12 or 20 quarters. This simple approach can meaningfully reduce year-over-year volatility in distributions, which grantees and budget-conscious boards tend to appreciate.
The key design decision is the length of the averaging window – that is, a longer period smooths more but responds more slowly to a changing environment. A shorter period responds more quickly but allows more market volatility to flow into annual spending. We believe boards should therefore select the averaging period in the context of their grant commitments, operating dependence, liquidity, and tolerance for changes in annual distributions, rather than viewing the window as a purely technical decision.
• Inflation-linked policies generally begin with the prior year’s dollar distribution and increases that amount by an inflation measure. Hybrid versions then blend that inflation-adjusted amount with the market value component or subject the resulting distribution to minimum and maximum effective spending rates.
For example, a foundation might increase the prior year’s distribution by inflation but limit the final payout so it remains between 4% and 6% of the current market value. The purpose of the range is not to target the highest permissible distribution. Instead, the floor may prevent spending from falling too low relative to the portfolio after strong market growth, while the ceiling can limit the risk that an inflation-adjusted dollar amount becomes unsustainably large following a market decline.
Inflation-linked and hybrid models are more complex than a straightforward asset-based or rolling average calculation, but they can balance year-to-year predictability with protection of the portfolio. Their effectiveness depends on clearly defined calculation rules, appropriate limits, and board discipline. Repeated exceptions can undermine the protections the structure is intended to protect.
For Example:
Consider XYZ Community Foundation, an illustrative organization that is weighing its spending policy options. XYZ is a typical community foundation with the following characteristics:
- $250 million in assets
- Relies on the investment portfolio, to a moderate degree, to support operational expenses
- In the midst of an unpredictable fundraising environment and reduced government grants
- Facing an uncertain macroeconomic landscape, highlighted by recession concerns and an elevated
interest rate environment - Needs to balance ongoing grantmaking with period increases in community demand.
In our experience, XYZ’s circumstances are broadly representative of many community foundations. The question facing XYZ is therefore not whether it should spend, but rather which methodology provides the most appropriate balance among near-term spending, predictability for grantees, liquidity, inflation protection, and preservation of long-term purchasing power.
The above is an illustrative example of a theoretical scenario and is not intended as investment advice. NEPC does not provide legal or tax advice. Please see additional disclosures throughout these materials.
What The Illustrative Modeling Tests
To compare the mechanics of the three approaches, NEPC developed a five-year illustration using the following common assumptions:
- Starting portfolio value: $250 million
- Initial spending rate: 5.0%
- Initial dollar distribution: $12.5 million
- Return assumption: 4.7%
- Inflation assumption: 3.0%
- Inflation-linked or hybrid policy bands: 4.0%-6.0%
The return assumption reflects a beta-only expected return based on the asset allocation of a representative community foundation portfolio and excludes any value-add from active management. The assumption is intended solely for illustrative purposes and is not a forecast or expected return for any specific foundation. This illustration is not a forecast and does not identify one universally optimal methodology. It is intended to show how the same starting portfolio and spending objective can produce different distribution paths depending on the policy formula selected.
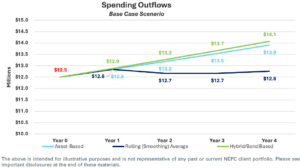
The results demonstrate that spending methodology, not simply spending rate, can materially affect annual distributions over time. While no single approach is inherently superior, each reflects a different tradeoff between spending stability, responsiveness to market conditions, and preservation of long-term purchasing power.
Current Market Value Asset-Based Policy
Because XYZ has only a moderate reliance on portfolio distributions for baseline grantmaking, a current value asset-based spending policy remains a viable option. It is straightforward to calculate and communicate, and it allows spending to participate in portfolio growth relatively quickly.
The tradeoff, however, is that annual grantmaking becomes more closely linked to market value. Under a different market path than the one illustrated, the same formula could transmit portfolio gains or losses into spending more quickly than a multiyear average. That may be acceptable if XYZ has flexible grants, diverse sources of funding, and sufficient reserves. It may be less appropriate if grantees or the operating budget depend on a stable distribution.
Rolling average policy
The rolling average approach can reduce the influence of a single year’s market value and create a more measured distribution path. That can help XYZ plan its operating budget and give grantees greater visibility into future support.
The tradeoff is that smoothing does not eliminate risk. A trailing average may maintain spending temporarily after a market decline, which can place additional pressure on the portfolio, and it may allow spending to rise more slowly during strong markets. The length of the averaging period should therefore reflect how much stability XYZ needs and how quickly it wants spending to respond to a sustained change in asset value.
Inflation-linked or hybrid policy
The inflation-linked or hybrid approach provides the strongest direct connection between annual spending and the purchasing power of the prior year’s distribution. In the illustration, the $12.5 million initial payout increases by 3% annually and remains within the 4%-6% market-value bands throughout the modeled period. This structure may be attractive if XYZ prioritizes consistency in the real value of its grantmaking. The floor and ceiling can also act as predetermined decision rules when the inflation-adjusted payout would otherwise become unusually low or high relative to the portfolio.
The tradeoff is greater complexity. The board must understand which inflation index is used, how the market-value component or bands operate, and under what circumstances an exception is permitted. Without that discipline, the policy can become an inflation-adjusted formula in favorable environments and a discretionary formula in difficult ones, weakening the benefits of the original design.
There Is No Universal Answer
Spending policy is best understood as a strategic governance tool, not a static formula. The right policy should simplify annual spending decisions, manage risk for both the foundation and grantees, and fortify the relationship with donors and the community. Foundation boards can benefit from examining
multiple spending policy options to determine which approach will fit best.
The objective is not to identify the formula that produces the highest distribution in a particular illustration. It is to select a policy whose behavior the board understands and can sustain across a range of environments. Scenario analysis can then be used to test that policy against the risks that matter most to the foundation, including market declines, elevated inflation, reduced fundraising, or a temporary increase in community need.
Selecting a spending policy is not a one-time exercise. Community foundations evolve over time as board membership changes, leadership transitions occur, fundraising patterns shift, and grantmaking priorities evolve. As a result, foundations may benefit from periodically revisiting whether their spending policy continues to align with their mission, operating model, and long-term financial objectives.
In our experience, spending policies are often worth revisiting following significant governance changes, such as board or executive leadership turnover, or after meaningful strategic or operational shifts within the organization. Even absent major change, a review every five to seven years can help ensure stakeholders remain aligned on the policy’s objectives, assumptions, and long-term implications.
NEPC works with community foundations to evaluate spending policies within the broader context of governance, asset allocation, liquidity management, and organizational objectives. Through policy reviews and scenario analysis, boards can better understand how today’s spending decisions may affect future grantmaking capacity and long-term financial sustainability.
1 Council on Foundations, & Commonfund Institute. (2025). 2025 Council on Foundations–Commonfund Study of Investment of Endowments for Private and Community Foundations. Council on Foundations. https://cof.org/content/2025-council-foundationscommonfund-study-investment-endowments-private-and-community.
Frequently Asked Questions
Many are recognizing the need for clear guidelines on appropriate use, privacy, risk management, and staff training before adoption outpaces governance.
The risks discussed at FAOG 2026 included cybersecurity, data protection, governance, and staff oversight, balanced against efficiency gains and reduced administrative burden.
Leaders are increasingly evaluating operational, technology, cybersecurity, data management, and AI-related policies.
EMAs are accounts where donor assets are managed by an outside investment manager or advisor while held at the foundation. Many foundations are evaluating how EMAs fit within their donor engagement strategies and investment offerings.
The consistent message from FAOG 2026 was that governance, operations, and stakeholder communication should evolve alongside the initiative, with the right framework in place before scaling.
Conferences like FAOG offer direct exchange with peers tackling similar issues, from AI policy to internal controls to EMA program design.