Corporate defined benefit plans continue to live in heady times as they come off another year of robust returns fueled by public markets and elevated funded ratios, according to NEPC’s annual Corporate Defined Benefit Peer Study1 and Survey2.
With another year of higher funded levels and shrinking liabilities under their belt, many plan sponsors must decide between retaining their plans and managing risk internally, or pursuing a pension risk transfer. Our survey last year found that many plan sponsors were looking to retain their plans for the long term. This year, the results of our survey offer a similar conclusion, but the case for termination may be too strong to ignore for some plan sponsors. In the interim, as volatility weighs on markets, plan sponsors will need to focus on aligning assets and liabilities while maintaining discipline around strategic asset allocation targets.
Each year, publicly traded companies are required to disclose information on their defined benefit plans as part of their annual Form 10-K reports filed with the Securities and Exchange Commission (“SEC”). The key measures disclosed in these filings include plan assets, liabilities, funded status, expected return on assets assumptions, discount rates, and plan allocations. The observations that follow are based on a review of filings from over 200 plan sponsors.
Similar to earlier years, we also surveyed corporate plan sponsors to gather views on key issues ranging from future objectives for their plans to perspectives on pension risk transfers; we received responses from 46 plan sponsors.
Data from our survey, combined with publicly available form 10-K filings, provide a comprehensive snapshot of the health, trends and key themes dominating the universe of corporate defined benefit plans.
These are our primary findings:
1. Funded Status Levels Rise (Yet Again)
With funded status holding at elevated levels, plan sponsors find themselves at a crossroads, deciding whether to transfer pension risk or continue managing assets in-house.
- Our peer study showed the aggregate funded ratio increased to 103% in 2025, up from 101% the prior year. Aggregate funded ratios have remained between 97% and 103% over the past five years.
- Even though funded status levels remain elevated, we did not observe further de-risking in 2025, with the average asset allocation across our peer group roughly unchanged year-over-year (more details below).
- Plan sponsors still appear to be undecided on plan termination. In our survey, 41% of respondents intend to fully terminate their plans over the long term. While this is up from 23% of respondents in the 2025 survey, we note that 45% of respondents plan to fully retain their plans over the long term.
2. Varied Use of Surplus Assets
As funded ratios have increased, so have total surplus dollars available to plan sponsors. Planned uses of surplus assets varied across respondents in our survey.
- Across our peer data set of 218 companies, aggregate surplus assets totaled more than $36 billion (average surplus per plan across the data set was $167 million).
- For most survey respondents, the plan for using surplus assets was fairly straightforward, as the majority noted they expect to use these funds to “cover all future plan-related costs,” or “reduce potential future contributions.”
- When asked about other potential uses of surplus, many plan sponsors indicated there was no concrete path forward. The most common response was “no plans for further use of surplus,” or “unsure.”
- Very few responses received indicated surplus assets would be used to reopen plans, create new cash balance benefits, support of M&A activity, or cover retirement medical benefits.
3. Fixed-Income Allocations Unchanged
Total allocations to fixed income appear to have plateaued, but interest in diversifying within fixed income may be increasing:
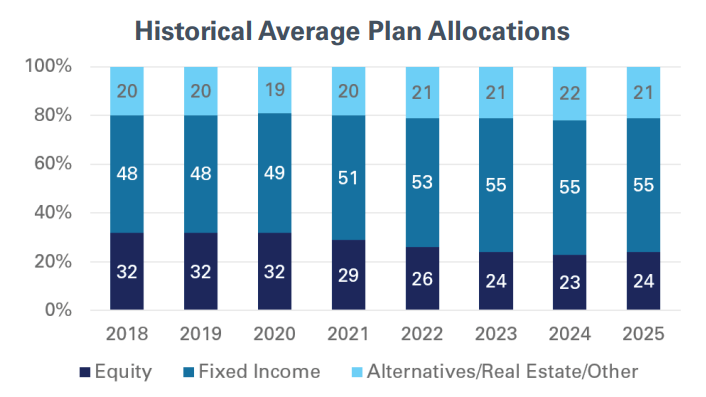
- Our peer study showed fixed-income allocations remained flat, with an average allocation of 55% in 2025 – the same level observed in 2023 and 2024.
- Continued strong returns from public equity markets may be responsible for the lack of change in fixed-income allocations.
- Another potential explanation is that plans that are heavily allocated to fixed income are terminating, leaving the remaining universe with more modest fixed-income allocations.
- For example, we noted eight companies in our database that fully terminated their plan last year; those plans, on average, had 68% allocated to fixed income prior to termination.
- With fixed-income allocations for the broader universe roughly flat, interest in non-traditional LDI diversifiers (e.g., private placements, structured products, real estate debt) may be increasing. Our survey noted that 37% of plans are currently using at least one of these diversifiers.
4. Return Expectations Remain Steady
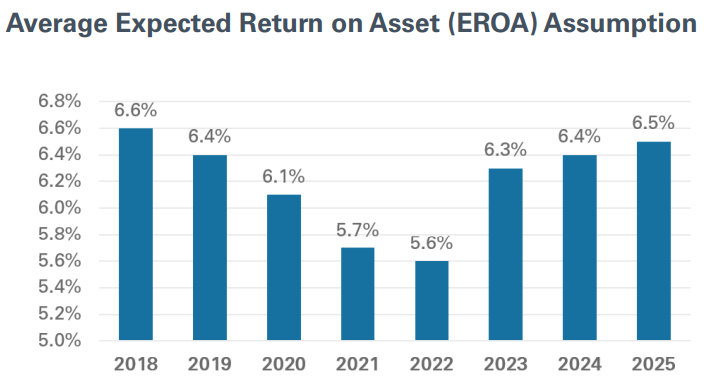
After a decade-long decline, the expected return on assets (EROA) assumptions moved higher for the third consecutive year.
- Based on our 10-K peer group data, the average expected return on assets (EROA) assumption increased to 6.5% in 2025, up 10 basis points since 2024 and up 90 basis points since 2022.
- About 33% of plan sponsors raised their EROA assumption in 2025, while 41% held it constant.
5. Other Trends From Our 10-K Study and Survey Data
- The average discount rate was 5.4% at the end of 2025, down 10 basis points from the prior year.
- At the sector level, dispersion of funded status persisted, with financials (113% average funded ratio) and utilities (107%) the most well-funded; on average, energy (94%) and communication services (92%) had the lowest funded ratios.
- Many plans are in a strong funded status position with approximately 75% of the universe ending the year with a funded ratio of 90% or higher; only 7% of plans had a funded ratio worse than 80%.
- Plan sponsors continue to have mixed views on the greatest threats to their programs: 25% of survey respondents cited inflation, 25% pointed to regulatory or legislative changes, and 18% highlighted liquidity constraints. Only 10% cited geopolitical tensions as the survey was conducted in early January, prior to the war with Iran.
With funded status remaining elevated, we recommend clients continue to review strategic asset allocation targets and overall interest-rate hedge ratios. As market volatility has increased in recent weeks, we believe now is the time to protect gains in funded status achieved over the last several years.
We welcome the opportunity to discuss this subject in greater detail. We can also provide a copy of our survey results. To learn more, please contact an NEPC consultant.
1 NEPC peer data based on 2026 10-K filings with the SEC. Peer class includes data from 218 plans. Nearly all companies report data using a December fiscal year-end. There are a limited number of companies which have a fiscal year-end with a date other than December 31st. We do not attempt to adjust for these differences.
2 2026 Plan Sponsor Survey collected from 46 participating plan sponsors. Included complete answers only and collected from current and prospective NEPC corporate and healthcare clients.