Introduction
We have observed private debt become omnipresent in portfolios as investors gravitate towards this asset class for its potential to provide relatively higher yields and the diversification it offers.
This relatively nascent investment class can fill a financing gap for companies who cannot or choose not to borrow from traditional lenders such as banks. Given its rapid ascent and evolution, the private credit landscape continues to change in terms of market dynamics, key participants, underlying strategies, and portfolio implementation. At NEPC, we believe that with the right partners, particularly those with experience through different market cycles, private debt offers an attractive risk-adjusted return. As a result, manager selection is a key component of the decision-making process prior to making an investment.
In this paper, we seek to demystify the world of private debt investments. To learn more about private debt, or to conduct asset allocation and enterprise risk management studies to determine an appropriate target allocation for your portfolio, please contact your NEPC consultant.
Origin, Growth and Size
Private debt strategies emerged out of necessity and opportunity following the 2007–2008 global financial crisis when banks and other traditional providers of credit scaled back their lending activities.
Since then, the share of bank lending to U.S. GDP has declined materially as regulatory considerations have forced banks to reassess the most capital efficient uses of their own balance sheet. Additionally, pressure from shareholders has caused banks to prioritize return on-equity and allocate resources to offerings with higher profitability. For example, from 2020 through Q4 2024, the average size of U.S. dollar-denominated high-yield deals has exceeded $700 million, while leveraged loan deals have averaged $450 million over the same period, according to data from BlackRock and Dealogic, underscoring the trend of U.S. public debt markets increasingly catering to larger borrowers.
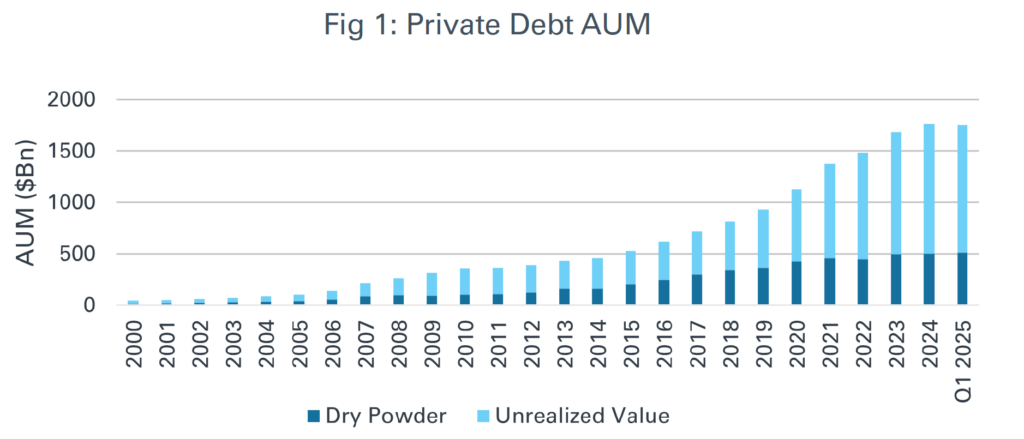
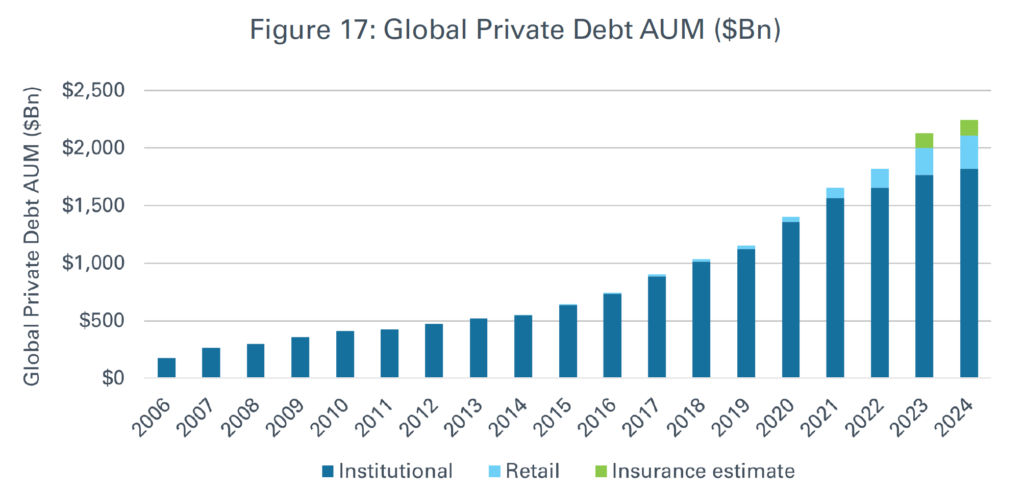
These developments have left financing gaps, making it more difficult for small- and mid-sized firms to access public funding. Although Europe’s high-yield and leveraged loan markets are smaller than those in the U.S., they exhibit similar barriers to entry. As private debt managers stepped in to fill this gap, the market for private debt assets under management continues to grow, reaching approximately $1.7 trillion, according to Preqin. This figure represents roughly 11% of the $15.5 trillion private capital investment universe1. The substantial growth across private debt has been fueled by both structural and demand-oriented dynamics.
We believe borrowers continue to seek private debt as financing solutions for several reasons. Many prefer its model of directly originated and underwritten transactions, which eliminates the need for investor roadshows and rating agency reviews that are often required in other forms of debt financing. This approach can also help borrowers keep proprietary information out of the public domain.
Additionally, private debt can provide greater certainty of execution, especially during periods of market volatility, as transactions are directly negotiated with a single lender or a small group of lenders rather than depending on syndication to a broader investor base that may become more risk-averse in turbulent conditions. The directly negotiated structure of private debt also allows for greater flexibility and customization of deal terms, both at origination and throughout the duration of the loan. Each of these factors can contribute to the willingness of borrowers to pay a premium for private debt relative to public credit.
Investor Demand
Investor appetite for private debt also appears to have strengthened. A Preqin survey of institutional investors revealed that the top reasons for allocating to private debt include its reliable income stream, diversification benefits, higher risk-adjusted returns, and reduced portfolio volatility.2
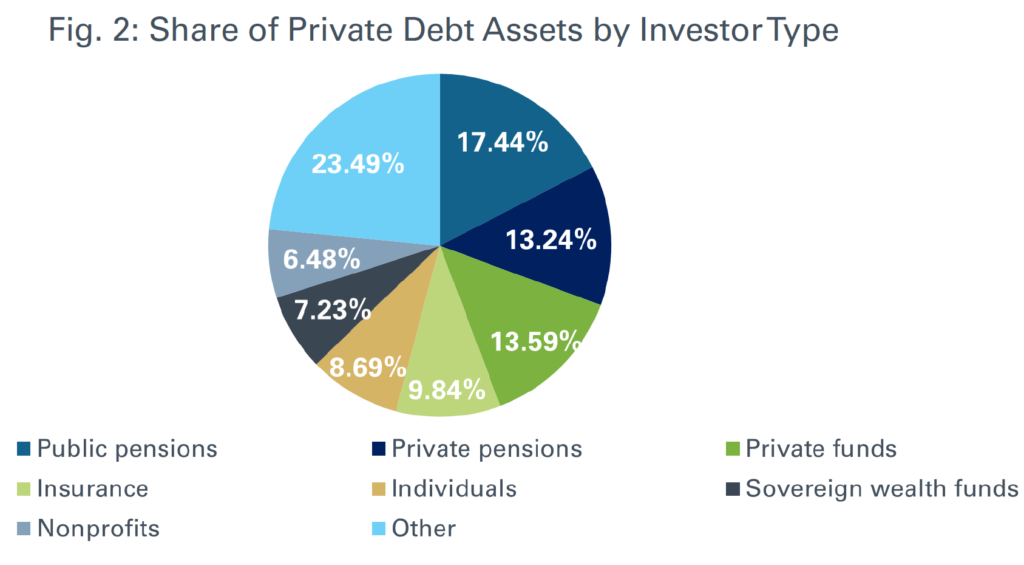
The Preqin survey also signals further growth in private debt allocations. Of the respondents, half indicated they plan to increase their commitments to private debt over the next 12 months, which was the highest percentage among all alternative asset classes, while only 8% plan to reduce allocations, the lowest share among alternative investments. While the role of private debt varies, depending on each investor’s specific financial objectives and constraints, its broad adoption across different profiles of investors highlights its versatility within a portfolio (Figure 2).
Investor Negotiations
Despite significant investor demand for private debt, prospective limited partners may still maintain some negotiating power with general partners. The time for managers to close funds has been lengthening, with the average time to close a private debt fund reaching 20.3 months in 2024, up from 15.1 months in 2019, according to PitchBook3. In this competitive fundraising environment, GPs may be increasingly receptive to discussing discounted economics or other negotiated fund terms in an effort to secure LP commitments, reach target fund sizes and expediate final closes. In an asset class like private debt, where upside potential for returns is often capped, this is a way for LPs to potentially drive stronger alignment and/or generate incremental alpha for their portfolio.
Too Big Too Soon?
Given private debt’s rapid expansion over the past 15 years, a prudent question arises: Has the asset class become too large? At first glance, this concern may seem valid, especially with private debt AUM reaching $1.7 trillion. However, putting this growth into perspective, while that number is substantial in absolute terms, it still represents only ~1.1% of total global fixed-income assets.4
Moreover, private debt is not a homogeneous asset class, it spans a diverse range of strategies, each serving different capital needs and segments of the market. Rather than being concentrated in a single area and oversaturating the opportunity set, the asset class continues to evolve as a broad and dynamic component of the global credit markets. Some private debt strategies provide financing to strong-performing businesses for growth; others focus on underperforming or distressed opportunities, while some target non-traditional and/or non-corporate borrowers.
Even within direct lending, private debt’s largest segment, there should still be room for further market penetration. Institutional direct lending drawdown funds have $678.5 billion in AUM as of June 2024, compared to $91.3 billion in 2014, according to PitchBook. This growth represents a compound annual growth rate of 22.2% while private equity AUM growth has a 10.8% CAGR over the same period, heightening concerns around unsustainability. However, the absolute AUM in private equity still far exceeds that of direct lending at $5.7 trillion and $678.5 billion, respectively.
We have also seen mergers and acquisitions in private equity serve as a large driver of deal flow within direct lending. This offers ample opportunity for private debt funds to further grow into the private equity footprint. Within direct lending, capital is also being distributed across various geographies and company sizes in upper, mid and lower markets. Private debt, and direct lending in particular, has historically focused primarily on lower- and mid-market transactions. However, in recent years, we have observed that rising interest rates, economic volatility and geopolitical uncertainty have caused the upper market to open up as another opportunity set.
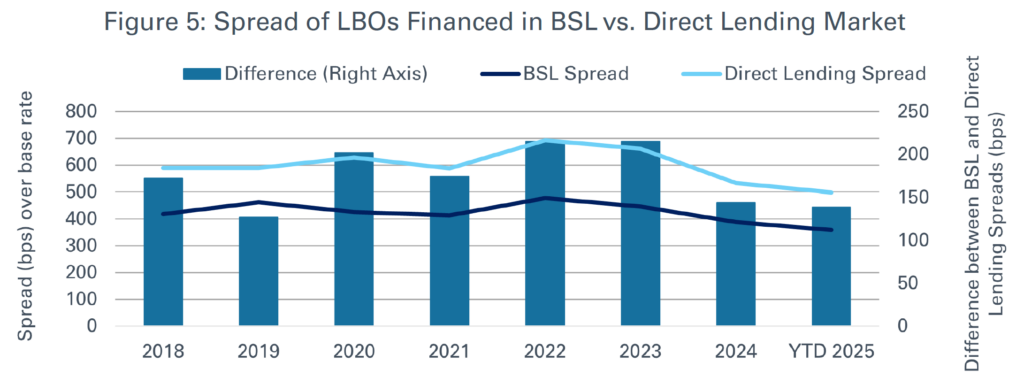
In addition to the aforementioned banking constraints, in 2022 and 2023, underwriting losses from investments preceding the rate hikes have forced banks to offload distressed positions and have fueled, at least temporarily, further retrenchment. However, in 2024, the market environment shifted, and broadly syndicated markets experienced heightened activity. This caused credit spreads for widely syndicated loans to tighten to near record levels, as demonstrated in Figure 5, making them a more attractive option for some borrowers relative to the higher interest expenses associated with direct lending loans.
Given this rapidly evolving competitive landscape at the higher end of the ecosystem, it is important to note that, with direct lending in particular, not all parts of the market are created equal: each segment offers distinct benefits and considerations. Larger funds and related pools of capital mean private debt firms can accommodate bigger hold sizes and exert greater control in debt tranches; it also translates into credit protections getting diluted, as the larger end of the market is marked by increasingly covenant-light deals that more closely resemble the terms on broadly syndicated loans. This may result in a ceiling on spreads for these larger loans, as borrowers can shop debt in both public and private markets, though small- and medium-sized companies are mostly excluded from this dynamic. Further, there are relatively few private debt managers with the scale to participate in the upper market when deals require clubbing multiple lenders. Often times, this leads to a material amount of overlapping exposure amongst different GP portfolios.
Overall, in our opinion, the gaps created by the pull-back of traditional lenders, robust borrower demand for financing, strong LP appetite, and the asset class’s broad mix of underlying strategies point towards continued expansion of the private debt market.
Deal-Level Metrics
Deal-level metrics can play a critical role in assessing the current private debt market environment. These data points should be considered not only on an absolute basis, but also on a relative basis to understand how they compare to historical data. Below are several key metrics relevant to private debt, along with insights into their potential impact on existing portfolios and the opportunities they may present for investors in today’s market conditions.
Figure 4 shows private capital M&A and U.S. private equity exit values, overlayed with the fed funds rate. M&A activity has steadily declined since its peak in 2021, coinciding with the uptick in interest rates.
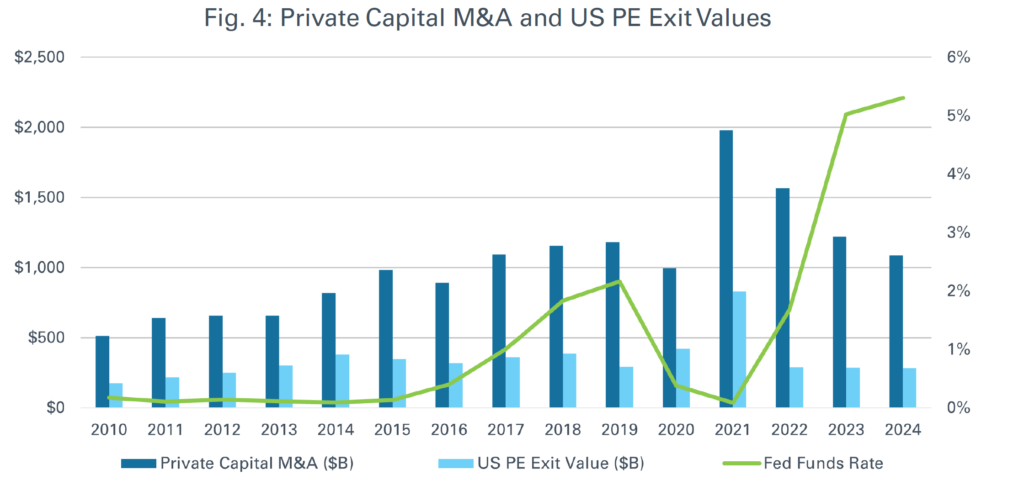
Elevated rates increase the liabilities of borrowers, impact company valuations and result in fewer leveraged buyouts. This dynamic, coupled with certain borrowers having limited alternatives to access materially cheaper debt via refinancing, has led to extended duration on many direct lending deals. The decline in realizations has already resulted in certain managers requesting extensions on fund terms in order to fully wind down existing portfolios. We believe this has opened up an opportunity for credit secondaries managers to capitalize on these deals as GPs and LPs look for avenues to achieve liquidity or rebalance portfolios. It could expand the addressable market for credit secondaries funds, improving their ability to be selective and drive more attractive deal terms as these funds look to new deployment.
As LBO financing opportunities remain limited, we have observed direct lending funds increasingly turn to add-ons as their primary source of new deployment. With add-ons, managers tend to have existing exposure to the borrower, and have more insight into the company, which aids in the diligence and underwriting of deals. However, these transactions tend to be smaller in size than LBO debt facilities, so aggregate deployment continues to be down. It will be beneficial to monitor any movement in the fed funds rate as potential future rate cuts may fuel increased deployment for strategies like direct lending.
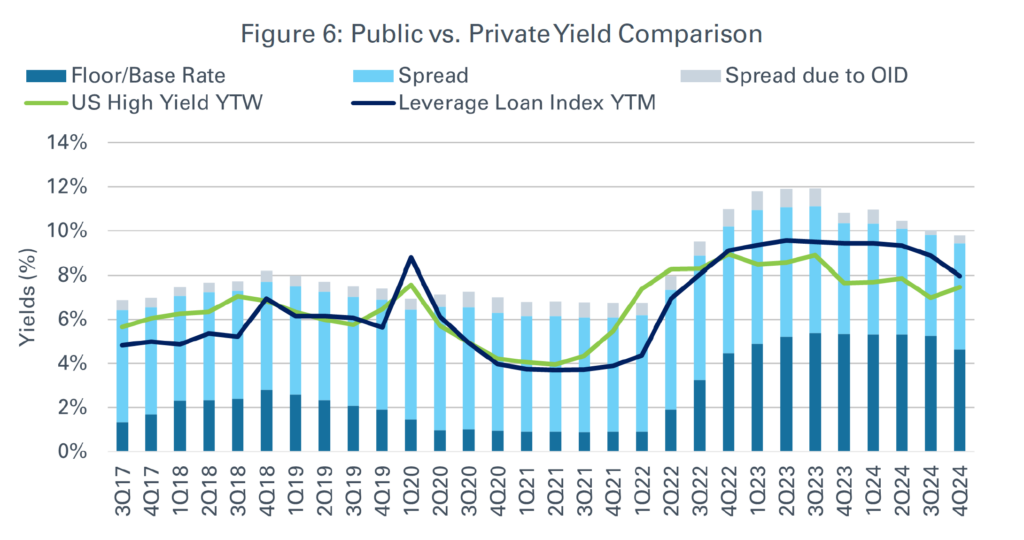
As mentioned, private debt managers are facing increased competition from broadly syndicated loan markets after the latter took a step back during the period of interest rate dislocation. Broadly syndicated loan markets are offering lower pricing to win back larger borrowers that were being financed by private-debt-backed unitranche loans over the previous two years. Direct lending loans have also experienced some spread compression recently due, in part, to the heightened competition for financing, but not to the same extent as broadly syndicated loans.
Although spreads on new deal activity in direct lending have come down, all-in yields are still attractive. Elevated base rates have helped to offset the spread compression (Figure 6).
Middle-Market Metrics
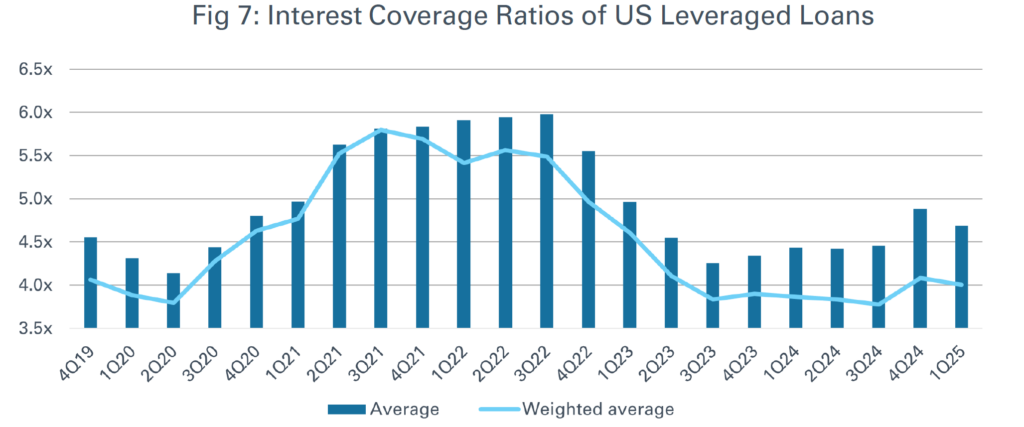
Middle-market yields, used as a proxy for direct lending, still remain materially elevated relative to before 2022, and are generally 100 to 300 basis points higher than the public markets. As a result, many investors are still getting an attractive return premium in direct lending compared to both previous vintages and public markets. That said, the depressed M&A market hinders, to an extent, the ability of managers to fully capitalize on this attractive yield environment. Further, returns are dependent on borrowers being able to service this higher cost of debt. Figure 7 highlights the burden of elevated rates on borrowers, with interest coverage ratios coming down across the market.
Transitional Deals
Borrowers with less liquidity to pay off loans provide an opportunity for transitional capital funds to step in with bespoke solutions for companies. These tend to be performing businesses in need of custom financing to help bridge the borrower until they can regain balance sheet stability. Relative to traditional direct lending, these deals involve a certain level of complexity, requiring the lender to possess specific expertise. These transactions can be structured in several different ways, depending on the specific borrower’s situation, but may include subordinated debt or structured capital, payment-in-kind interest to alleviate near-term liquidity concerns, and/ or equity components in order to generate higher returns and be compensated for taking on the added risk of investing in these companies.
Distressed and Opportunistic Credit
Beyond the opportunity for transitional capital, we have also observed an increase in the number of non-performing businesses in the current market environment amid rising default rates (Figure 8).
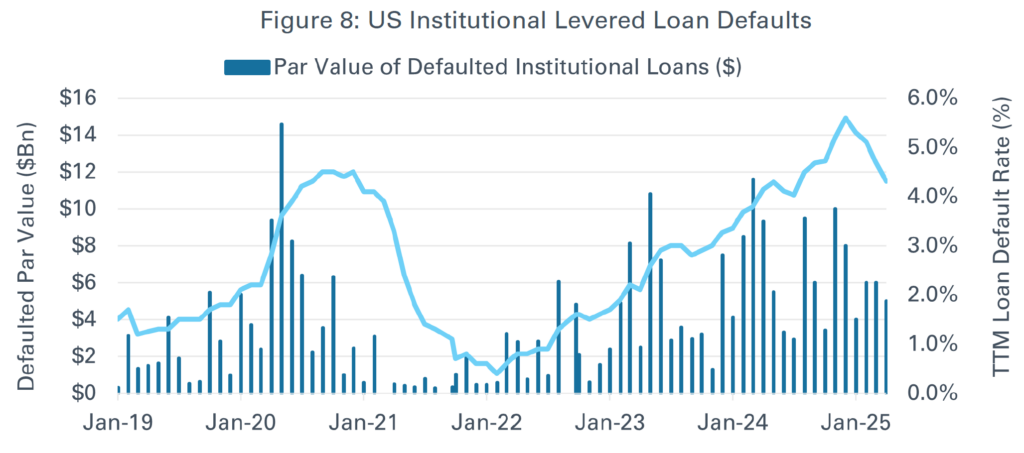
These default rates also likely understate the levels of stress in the market, as the data does not account for companies that have amended their credit documents or done other workarounds to avoid triggering a default. Within direct lending, an uptick in defaults may cause a bifurcation in the market between managers with the capabilities and resources to protect credit through periods of stress and distress, and those that have not prioritized developing internal restructuring competencies.
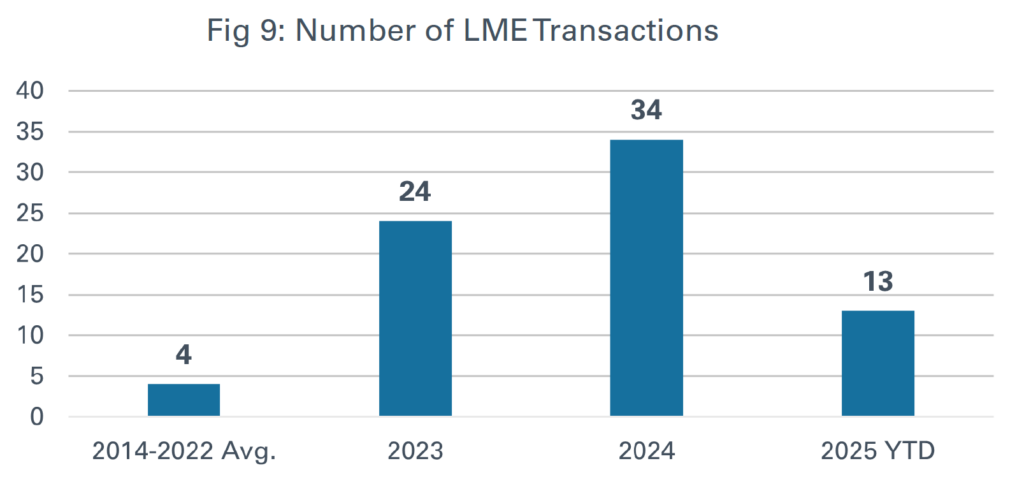
With distressed and opportunistic debt funds, an increase in defaults and underperforming businesses is a welcome development following a relatively benign credit environment dating back to the end of the financial crisis. Managers may be able to capitalize on this opportunity through primary origination deals (new money loans), or in the secondary market (usually at a discount) as there may be a spike in forced debt sales at attractive prices. Figure 9 demonstrates the number of businesses that need to resolve their debt, as shown by the recent increase in liability management exercises (LMEs). While the amount of LMEs is not yet at a recessionary level, it continues to trend upwards compared to the previous decade, and similar to the default data, it indicates a broadening opportunity set for distressed and opportunistic credit managers.
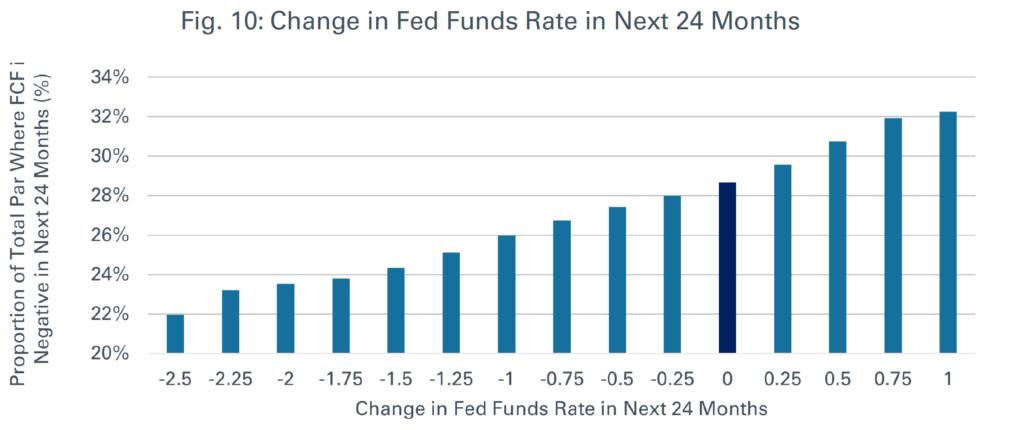
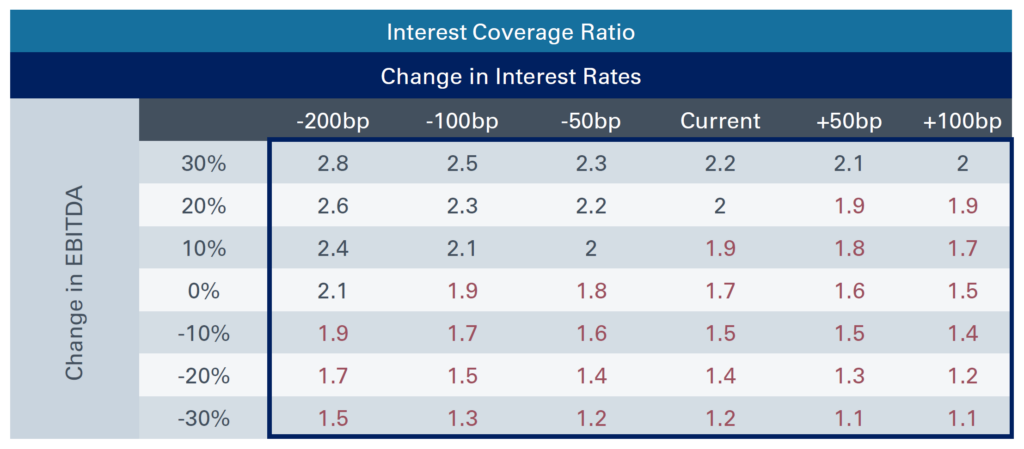
Certain investors have indicated to NEPC they believe that future interest rate cuts may resolve many of the challenges borrowers are currently facing. However, that is not necessarily the case for all companies (Figure 10). In the graph on the left, it shows the percentage of companies that will have negative free cash flow at different interest rates, with approximately 28% of businesses qualifying at current rates. The right and left of the figure show the impact of rising and declining rates, respectively. Even if rates decrease 2.5%, 22% of businesses will still have negative free cash flow, all else equal. The table on the right shows interest coverage ratios across the market at different interest rates and EBITDA growth.
Generally speaking, interest coverage ratios below 2x signify liquidity stressors and are noted in red. This analysis indicates that a material improvement in interest rates and EBITDA are needed to get many companies back above a comfortable threshold. It is not enough for companies to rely on just lower borrowing costs; they must also focus on operational improvement and enhancing profitability.
Given this analysis, we believe investors may consider further diversifying their private debt portfolios to complement existing corporate credit exposure. Certain funds targeting non-traditional borrowers, such as asset-based lending (ABL), could fit the bill as their returns are less dependent on a borrower’s operating results or broader economic conditions.
Private Debt Performance
There are several key factors that affect the performance of private debt, and we believe mindfulness of the interconnectivity of the fundraising period, investment period and deployment pace to be beneficial. Broader market conditions, macroeconomic variables and fund-specific situations shape risks and returns. The fundraising timeline dictates the availability of capital, investor appetite and prevailing market conditions at inception. The start of the investment period sets the stage for deal sourcing, pricing and portfolio composition. Deployment pace affects the fund’s ability to generate returns efficiently while minimizing cash drag.
As previously mentioned, fundraising timelines continue to increase. During this time, many managers will start to call capital and charge management fees. The management fees charged prior to the final close are exacerbated by these longer fundraising timelines. Moreover, NEPC has observed that a majority of funds’ investment periods do not start until after the final close. This may result in an investor’s capital being locked up for longer than expected. Furthermore, any fund-term extensions tacked on at the back end of the fund’s life can also result in a much longer illiquidity horizon than initially expected.
Broader market and economic conditions, including interest rates, inflation and economic cycles, affect the creditworthiness of borrowers and overall portfolio performance. Depending on market conditions, sector and geographic exposure can serve as risk mitigators or amplifiers. Strong credit quality and underwriting discipline help reduce watchlist assets and default risks; robust loan terms, such as covenants and tight collateral structures, enhance downside protection.
Active portfolio monitoring and restructuring capabilities are crucial for maximizing recoveries and minimizing losses. Additionally, the timing of realizations plays a role in either compounding interest or receiving prepayment fees and providing capital for recycling opportunities. Lastly, fund-level leverage can amplify overall risk and return potential, and increases the importance of cash flow management for general partners, making it an essential consideration in their portfolio construction.
In the current environment, while some underlying deal-level metrics may be sending out mixed signals regarding the attractiveness of certain private debt strategies, the asset class as a whole has remained resilient and delivered strong risk-adjusted returns. Figure 11 highlights the public market equivalent (PME) performance of private debt relative to the Bank of America High Yield Index, serving as a benchmark for assessing the opportunity cost of allocating capital to private debt versus public fixed income. Since its inception as a mainstream asset class, private debt has consistently outperformed public market indexes, generating excess returns typically in the range of 200-to-800 basis points, cementing its standing within a diversified portfolio.
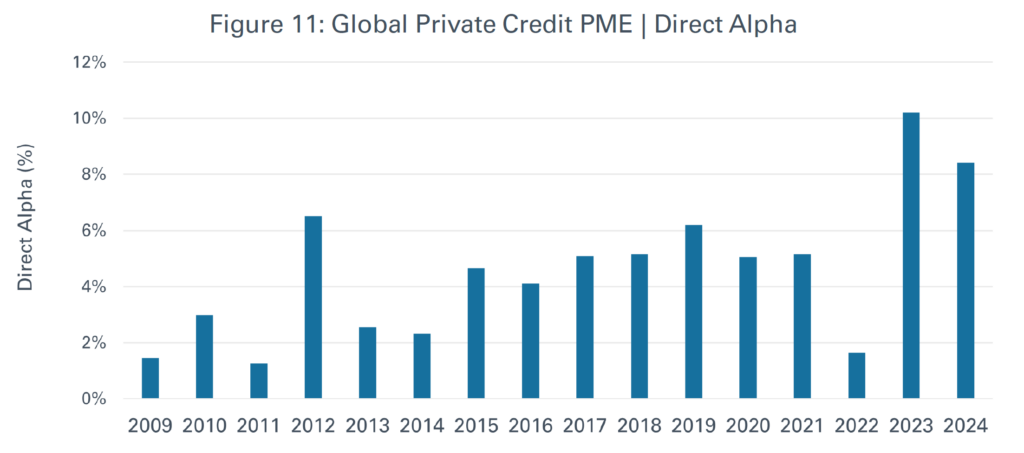
PD Out/Under-performance is shown based on a PME using the pooled cash flows of all funds across Private Credit PME method is Direct Alpha and benchmark is BofA HY Index
Performance of Direct Lending Strategies
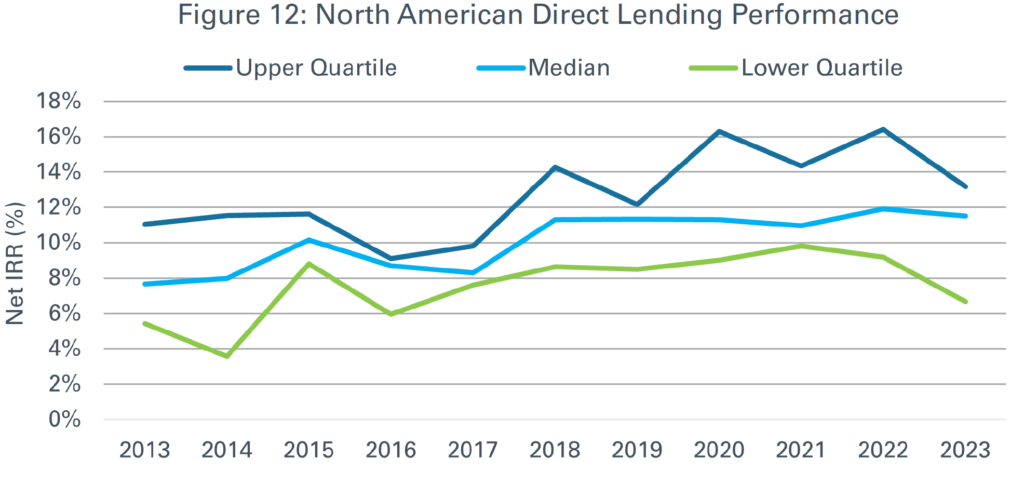
Direct lending is the largest strategy within private debt, accounting for approximately 37% of AUM in the asset class.1 As demonstrated in Figure 12, the performance of direct lending has been notably stable across quartiles over time. More recent vintages have seen an uptick in returns due, in part, to the elevated interest rate environment. Most direct lending deals are structured as floating-rate loans, so higher base rates can positively impact direct lending performance. An important caveat: borrowers must still be able to service their higher interest expenses. We believe future rate decisions by central banks in the U.S. and Europe should be monitored as they can impact direct lending returns; it is worth noting there is generally a three- or six-month lag between central bank decisions and when the pricing on direct lending loans resets to incorporate the new base rate.
That said, within this strategy, there are some potential headwinds to consider. Increased competition for deals amongst direct lending managers and a risk-on broadly syndicated loans market could lead to spread compression.
Additionally, some investments made before the rise in interest rates were completed with borrowers that, at the time of the deal, did not properly account for an interest load this high. This may result in certain borrowers having difficulty servicing their debt. An economic downturn could exacerbate these issues and fuel potential losses, which may drag down overall returns. We believe it will be beneficial for investors to consider partnering with managers that maintain strong underwriting discipline and have the necessary capabilities, resources and expertise to work through any troubled assets that may arise. This includes investors looking for managers that have the experience of investing through multiple market cycles. While seeking GPs with those skills may seem obvious, NEPC has observed that the number of managers that have these capabilities is far smaller than the size of the market.
Distributions
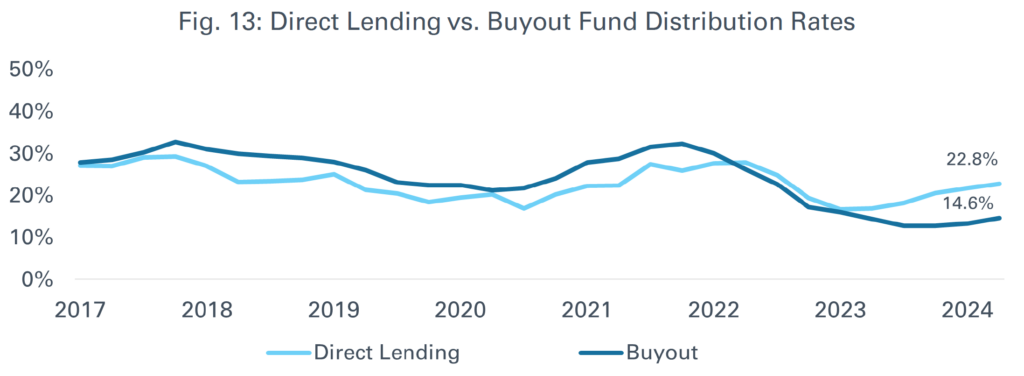
In private debt, distributions remain a key benefit, particularly in direct lending and other income-generating strategies. As discussed, the depressed M&A environment has extended the duration of loans. Most loans have a stated five-to-seven-year maturity, but most managers expect them to be realized well inside of that timeframe, typically within two to four years. Borrowers taking longer to repay principal on their loans has led to some private debt GPs extending duration and pushing out fund terms.
Although fund extensions can be inconvenient for investors, LPs continue to receive steady current income of 7%-to12% from interest payments, fees and amortization. This contrasts with other alternative investments like private equity, where distributions are limited due to longer exit timelines and fewer avenues to collect proceeds prior to full realization. Additionally, manager selection plays an important role in this dynamic, as investing with GPs that have demonstrated a track record of achieving first quartile DPIs and avoiding fund-term extensions can further enhance the distribution benefits of the asset class. As a result, private debt provides investors with a valuable source of cash flow within a broader alternatives portfolio.
Performance of Junior Capital and Distressed/Opportunistic Credit Strategies
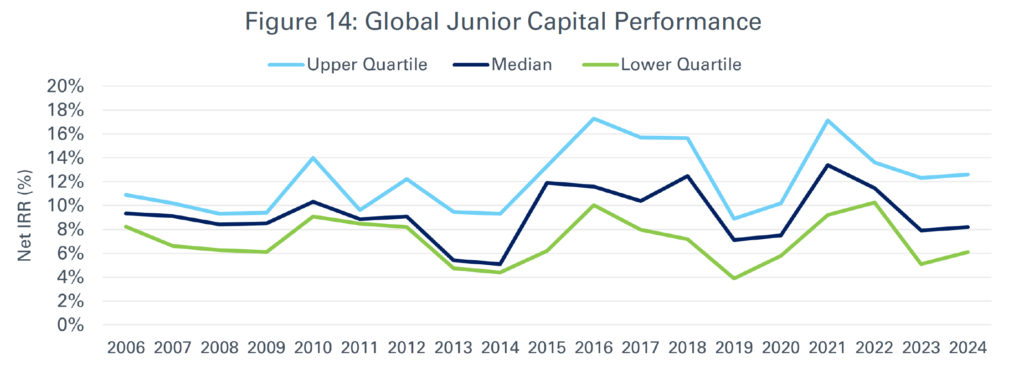
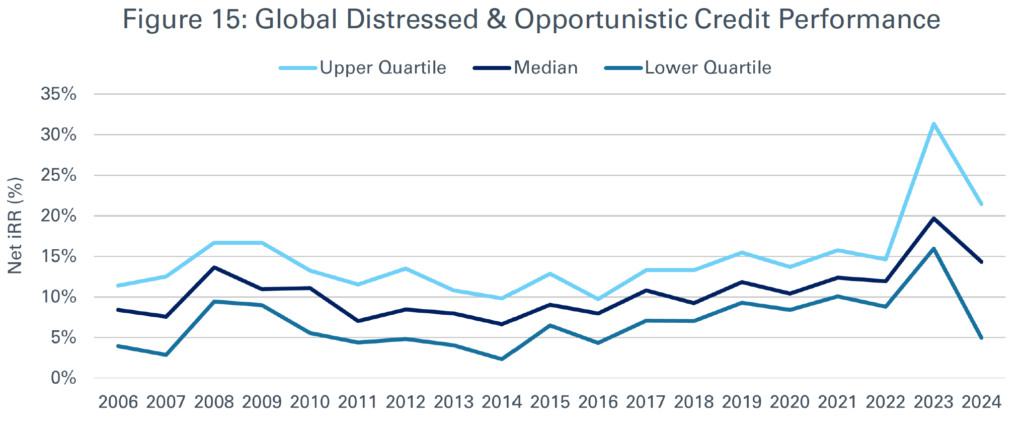
Two other prominent strategies within private debt are junior capital and distressed/opportunistic credit. Figures 14 and 15 show the performance of junior capital and distressed/opportunistic credit over time. Junior capital, once primarily associated with traditional mezzanine debt, has expanded into a broader range of deal structures, particularly in response to rising interest rates that have created financing gaps in capital structures. Junior capital strategies will oftentimes invest in portfolio companies through debt and equity instruments. We encourage awareness regarding this dynamic, as the mix of deal structures and exposures may ultimately dictate the true risk/ return profile of the strategy and the fund’s duration.
Junior capital and distressed/opportunistic credit exhibit a wider dispersion of returns compared to direct lending. Notably, distressed/opportunistic credit strategies have produced lackluster third quartile returns in general, and first quartile outperformance has skewed towards periods of market dislocation and volatility. Further, GPs that have exhibited sub-par performance previously may be inclined to try and swing for the fences to overcompensate. Given the high return dispersion in these strategies, we believe manager selection is particularly critical to achieving strong risk-adjusted outcomes.
Notable Market Developments
In a shifting landscape, we believe awareness of these developments within the private debt space to be important:
Industry Consolidation
The private debt industry has been experiencing significant consolidation, with capital becoming increasingly concentrated among the largest managers. In 2024, the top 10 largest private debt managers accounted for approximately 32% of capital raised, up from 26.6% in 20215, according to PitchBook. This signals a trend where LPs are streamlining GP relationships and committing less to emerging or specialized managers, despite historical data suggesting these managers often outperform.
Based on NEPC’s analysis, M&A activity amongst private debt firms has accelerated, with ~41 managers acquired in the past decade and ~17 of those deals happening in just the last two years, as of August 2025. Some high-profile transactions in 2024/2025 include BlackRock’s acquisition of HPS and TPG’s acquisition of Angelo Gordon. Broadly speaking, while these deals can enhance a firm’s resources, capital and capabilities, they can also present potential risks such as strategy drift, asset proliferation, and misaligned incentives. Are the LPs still the primary beneficiaries? Growth initiatives driven by new ownership may not always align with LP interests, particularly if the GP prioritizes expansion of assets under management over fund performance.
NEPC has observed that many acquisitions have pushed strategies up-market in an effort to increase deployment. Additionally, talent retention is a critical concern. Acquisitions often lead to leadership changes and team turnover, which can directly impact investment decisions and operational stability. LPs should assess whether key investment professionals remain incentivized and engaged after a transaction. Moreover, the level of hands-on involvement by the acquiring firm varies, influencing how the private debt platform is managed going forward.
As consolidation reshapes the private debt landscape, investors must evaluate whether their managers maintain strong alignment, incentive structures and investment discipline post-acquisition. Understanding how these transactions affect leadership, strategy and long-term performance is crucial for making informed allocation decisions.
External Participants
Investors should be aware of the influence that other market participants have on the private debt ecosystem. Notably banks, insurers and credit hedge funds have become increasingly significant in shaping this landscape.
Banks and private debt managers navigate a complex relationship as competitors and allies, and are deeply intertwined. The rise of private debt has increased the pressure to secure lending opportunities and attract top talent. As each group works to preserve its position within the lending ecosystem, their dynamic has grown more competitive. However, beneath the surface, banks and private debt managers share significant commercial ties that create mutual benefits. Banks provide subscription lines of credit and fund-level leverage, allowing private debt managers to deploy capital more efficiently and enhance net returns. In turn, private debt managers help banks manage regulatory capital constraints with activities such as purchasing assets off their balance sheets, providing risk transfer deals, or stepping in on hung syndications.
A growing trend is the rise of joint ventures (JVs) between banks and private debt managers. In 2024, some examples included Citigroup’s $25 billion private debt partnership with Apollo, Webster Bank’s venture with Marathon, and Wells Fargo’s $5 billion partnership with Centerbridge Partners. These partnerships allow banks to stay active in direct lending, while private debt managers gain enhanced origination capabilities and capital to scale their investments. As these partnerships evolve, it will be informative to watch how these dynamics influence deal flow, capital availability and investment opportunities in private debt.
Insurers are also becoming increasingly important stakeholders in private debt markets. The asset class has become a greater priority for insurers, as allocations to private debt can enhance yields on insurers’ general accounts, enabling more competitive liability pricing and higher ROE. This is particularly beneficial when liabilities reside in offshore jurisdictions where certain private debt assets carry lower capital charges. Funds offering rated feeder structures provide another tool for insurers to efficiently comply with the National Association of Insurance Commissioners (NAIC) and other regulatory bodies. Many insurers have historically held private debt investments on Schedule BA where they receive relatively high capital charges; however, rated note feeders now allow insurers access to the same underlying exposures while receiving bond-like capital charges.
Large insurers are increasingly shifting from passive LPs in traditional commingled funds to structuring customized investment vehicles, partnering with GPs, and/or directly participating in deals. Some insurers are even building or acquiring direct origination capabilities across private debt strategies that align with their liability profiles; others are forming large-scale partnerships with banks and asset managers to acquire assets without establishing their own origination networks.
Insurance capital remains an attractive funding source for private debt managers looking to scale their strategies and permanent capital bases. The long duration focus of private debt aligns well with the typical investment horizon of insurance firms and, as insurers primarily invest in fixed income, it has complemented GPs expanding their private debt franchises to capture insurance inflows and further grow AUM.
NEPC believes insurers will continue to be impactful within private debt given the rising demand for allocation, and GPs increasingly targeting relatively untapped investor segments to fuel further AUM growth.
The private debt landscape is also being reshaped by credit hedge funds which are increasingly overlapping within the asset class. This convergence is happening in two distinct ways: First, deal-level overlap between private debt and credit hedge funds is becoming more common. Opportunities such as dislocated public debt, asset-based lending, and even some more illiquid transactions can fit into either mandate, creating potential hidden duplication in exposures across an investor’s broader portfolio. As LPs assess new investments, particularly with hedge fund managers expanding into private debt, they should carefully evaluate the manager’s experience in handling these types of transactions, particularly the illiquid assets, as these may require a different skill set than traditional hedge fund investing.
The second convergence pertains to vehicle structures. Private debt managers are increasingly offering evergreen vehicles, which may somewhat resemble hedge funds in liquidity profile compared to traditional closed-end drawdown funds. Conversely, more hedge fund managers are launching closed-end drawdown vehicles to compete with private debt, though these funds typically have shorter durations and generally lean towards more liquid types of deal exposures than traditional private debt strategies. Investors need to ensure that hedge funds are skewing towards private debt not just as a way to become more marketable in fundraising.
As the lines between private debt and credit hedge funds may sometimes blur, it will be important to carefully assess deal exposure and fund structure to ensure they are accessing the right opportunities in the most efficient manner. Understanding a manager’s expertise, the fund vehicle terms, and alignment with LP investment objectives is critical in this evolving market.
Newer High-Profile Strategies
Asset-based Lending Strategies
Several private debt strategies, such as asset-based lending and credit secondaries, have recently gained attention. Historically dominated by banks, the ABL market has shifted as regulatory, liquidity and capital constraints have forced banks to reassess their priorities. This shift has created opportunities for private lenders to step in. ABL comprises two primary methods: asset-based lending and asset-backed lending, each offering a distinct approach to credit.
Asset-based lending involves directly originated loans to corporate borrowers, typically for incremental liquidity or transitional capital. Unlike cash-flow lending, these loans are underwritten to the net liquidation value of underlying assets, offering a collateral-driven approach.
Asset-backed lending more closely resembles structured finance and is rooted in the public asset-backed securities market. Loans are secured against pools of underlying cash flow-generating assets, either physical or financial. Some are securitized into multiple tranches of debt and equity with various payment priorities and risk/ return profiles. Public ABS are structured by securities broker dealers that distribute them broadly to investors who can then trade them in the secondary market with varying degrees of liquidity. Private asset-backed transactions, by contrast, are directly originated, negotiated and structured by GPs. As a result, private asset-backed lending can be tailored to specific risk/return criteria of investors and to the individual needs of a borrower. From a borrower’s perspective, asset-backed lending allows companies to use their assets as collateral to secure funding, free up space on their balance sheet, and diversify financing sources.
There are high barriers to entry into the ABL market due to the specialized expertise required to structure and execute these deals. This has resulted in relatively less competition compared to other private debt strategies, enabling managers to negotiate attractive spreads and terms. From an investor’s perspective, we believe ABL presents several advantages. It offers attractive current income, often high single-digits to low-to-mid double-digits (depending on the type of strategy), as it has an illiquidity spread premium relative to similarly rated corporate credit and public ABS, which often trade at tight spreads during periods of strong demand for credit.
ABL deals can also offer structural downside protection and periodic de-risking as they are typically self-amortizing and return capital on a regular basis, as opposed to the interest-only, bullet structure commonly used for corporate credit loans. This amortization feature can lead to increasing overcollateralization throughout the life of the investment and an overall shorter duration for assets. Further, ABL generally involves less fund-level leverage than other private debt strategies. Lastly, it can provide diversification benefits, as investments will often be made across different industries and sub-sectors, and its performance is less dependent on a borrower’s operating results or broader economic conditions.
However, investors must also consider certain risks. The shorter duration of ABL strategies can lead to higher portfolio turnover within funds, requiring active management from GPs to mitigate refinancing challenges. Additionally, fund fees for LPs tend to be higher than those in other private debt strategies due to the complexity and resources required for these transactions. While competition in ABL has historically been limited, the strategy has recently seen an uptick in new managers coming into the market with varying degrees of experience and track records.
ABL presents a compelling opportunity within private debt, offering diversification and attractive risk-adjusted returns. However, as competition intensifies, we believe it is important to be selective and partner with managers who possess the specialized skill set, established experience, and necessary infrastructure and resources required to succeed in this increasingly dynamic space.
Credit Secondaries
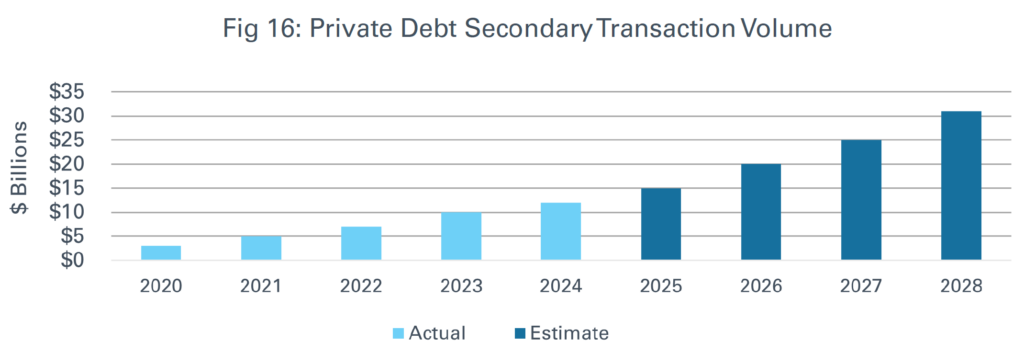
Another private debt strategy that we have seen garner significant attention recently is credit secondaries. This strategy involves purchasing existing private debt investments from other investors. These transactions can take several forms: LP-led transactions where managers acquire an LP’s stake in individual private debt funds or portfolios of funds; GP-led transactions where managers purchase a portfolio of private credit deals from GPs; and direct secondaries where individual loans or portfolios are bought from banks, insurance companies, or other institutions that invest off their balance sheets. Returns in credit secondaries come from current income generated by the underlying loans and capital appreciation from purchasing assets at a discount.
As demonstrated in Figure 16, deal volume in this space has historically been low due to private debt’s relative nascency as an asset class, as secondary transactions typically require mature investments/ portfolios or periods of market volatility. However, several tailwinds are expected to drive growth of this opportunity set. One such tailwind is the maturation of the private debt market which has expanded the pool of seasoned assets and portfolios. Additionally, LPs and balance sheet investors may look to sell positions as they seek liquidity or portfolio rebalancing solutions, while GPs may turn to the secondary market to crystalize performance, return capital to investors, and enhance their distributed to paid-in capital (DPI). As a result, the private debt secondaries market has expanded from $3 billion in 2020 to approximately $12 billion in 2024.
We believe private credit secondaries funds offer several attractive features. These funds tend to have a shorter duration than other private debt strategies, as transactions typically occur three-to-five years into a loan or portfolio’s lifecycle. They are also often highly diversified, spanning multiple borrowers, investment strategies, fund managers, vintages, and geography. The limited competition in this space—few managers offer dedicated secondaries strategies—creates opportunities to capture attractive yields through discounted purchase prices and strong underlying income streams. Additionally, credit secondaries benefit from reduced blind pool risk, offering greater visibility into the underlying seasoned assets.
However, investors must weigh key considerations before allocating to credit secondaries. Since this is a relatively new strategy, most managers have limited track records of successfully executing these deals. There is also potential for adverse selection as sellers may look to offload underperforming assets. Investors should also assess whether secondaries funds create duplicative exposures within their broader private debt portfolio, which could amplify downside risk in the event of underperformance. Additionally, secondary managers may have limited control over the underlying investments, particularly in workout or restructuring scenarios. Lastly, investors should be mindful of a potential double layer of fees, as they not only pay management fees and carried interest to the secondaries manager, but also may be subject to an additional layer of economics paid to underlying funds which could dilute overall performance.
Private credit secondaries can present an emerging opportunity within private debt, offering diversified exposure, strong yield potential, and shorter duration. However, given the strategy’s relative nascency, we believe it is important to carefully assess manager experience, potential asset overlap across their broader portfolios, and fee structures in order to ensure an optimal fit within their broader private debt allocation.
Vehicle Proliferation
We believe it is important to have a strategic plan to incorporate the right exposures to meet specific investment objectives and constraints when building out a private debt portfolio. We also believe it wise to be on the lookout for tactical opportunities that may arise as a result of broader market developments. But beyond just identifying investment opportunities, it is also important to consider how to access and implement those exposures. Recently, in addition to the traditional closed-end drawdown funds common in private debt, we have seen a host of new vehicle structures coming to market which may lead to increased adoption by investors.
Evergreen and open-ended funds (such as business development companies and interval funds) each offer distinct benefits, risks, and are suited to different investor needs. Evergreen funds will offer periodic subscription and redemption windows, often times ranging from quarterly to annually, subject to an initial multi-year lock-up period. However, it is important to note that evergreen vehicles can take many different forms, depending on the specific terms set by each GP. Terms that will vary among offerings include the length of the initial lock-up period, initial portfolio exposures (coming into a new portfolio versus coming into a seeded portfolio at net asset value), liquidity provisions, how redemptions are handled (organic wind down versus expediated liquidity), and how carried interest is calculated.
Additionally, it is important for GPs to have clear and equitable allocation policies as some will offer evergreen and closed-end drawdown funds that will invest alongside each other. We believe it will be important to carefully evaluate evergreen vehicles before investing as the distinct terms set for each offering will ultimately dictate suitability and relative attractiveness.
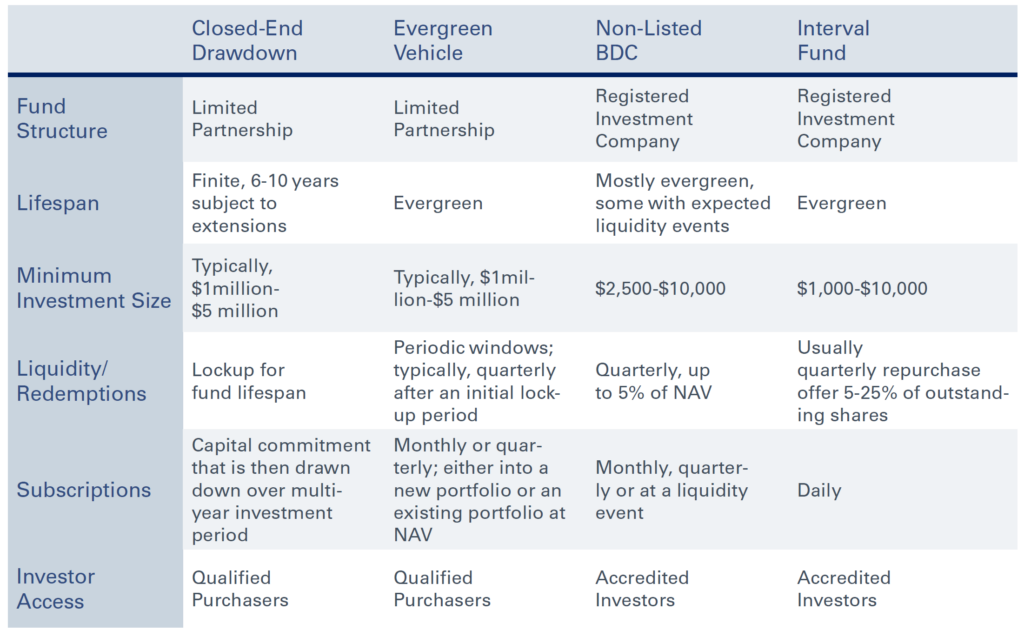
Regulations and tax considerations have historically made private funds difficult and/or inefficient for non-institutional investors to access. Evergreen and closed-end drawdown vehicles are structured as limited partnerships and can only accept commitments from qualified purchasers, as defined by the Investment Company Act of 1940. These vehicles will also have high minimum commitment thresholds, with NEPC typically seeing funds requiring at least $1 million from each investor. Open-ended vehicles, including business development companies (BDCs) and interval funds, make private investments more accessible to a broader investor base. These vehicles may be structured as registered investment companies (RICs) under the Investment Company Act of 1940, and can accept commitments from accredited investors, which have more attainable qualification requirements than qualified purchasers. Additionally, NEPC has seen these funds will offer lower minimum investment requirements ranging from $1,000 to $50,000.
Vehicle terms for open-ended funds will differ from evergreen funds. Open-ended funds generally offer more frequent subscription periods, often daily or monthly, and redemption windows, usually quarterly. Open-ended funds may also offer tax benefits for certain investors as a regulated investment companies (RIC) structure allows them to issue 1099 forms rather than a Schedule K-1 for evergreen funds. K-1s often require more complicated tax returns than just reporting dividends or income from a 1099. Furthermore, in our experience with RICs, interest income may qualify as portfolio interest, which is a category of U.S.-source income that is generally exempt from U.S. tax withholding. We believe this feature may be particularly appealing to offshore (non-U.S.) investors.
Disclosure: NEPC does not offer tax or legal advice. Please consult with your tax or legal professional as appropriate regarding these matters.
Although different in many ways, evergreen and open-ended funds share several advantages relative to closed-end drawdown structures. From the perspective of LP portfolio management, achieving and maintaining target allocations in private debt using closed-end drawdown vehicles can prove challenging. After commitments are made, capital is drawn and invested over several years without LPs having control over timing. LPs are, therefore, responsible for maintaining adequate liquidity to fund capital calls over time. Open-ended funds and certain evergreen vehicles can allow investors to get immediate exposure and mitigate the risk of inopportune/untimely capital calls.
Additionally, the NAVs of closed-end drawdown funds, which LPs use to assess current exposures and calculate pacing plans for future commitment amounts, will fluctuate due to the timing of capital calls and distributions.
In contrast, evergreen and open-ended funds will often be insulated from the impact on NAV from capital calls and principal distributions, helping them to maintain consistent exposure over time. As these funds often have perpetual terms, it limits the need for investors to continue investing in subsequent fund vintages to maintain their target allocations, which can be a hefty administrative burden. Beyond the portfolio management benefits of evergreen and open-ended funds, their perpetual nature can offer return enhancement as continuous deployment allows for long-term compounding.
From a GP perspective, closed-end drawdown funds compel managers to come back to market frequently to fundraise subsequent vintages of strategies. GPs also experience pressure to raise larger pools of capital for each subsequent vintage in order to avoid potential reputational damage. Closed-end drawdown funds may cause GPs to become victims of their own success, as profitable investments may be realized early, which reduces their AUM-related fee generation. We believe this dynamic is mitigated by evergreen and open-ended funds as GPs can collect fees in perpetuity. Management fees and carried interest can also potentially grow over time as AUM in these vehicles rise.
However, there are risks associated with evergreen and open-ended funds that investors need to consider. While the more frequent subscription periods offer investors greater flexibility on timing, it creates uncertainty for managers around capital availability and deal origination requirements, which they must navigate in order for the portfolio to remain fully deployed.
Similarly, while the more frequent redemption windows can allow investors to have enhanced liquidity, a run on redemptions could create an asset-liability mismatch for the fund. Managers generally try to combat this risk by implementing redemption caps on 5% of NAV or outstanding shares. However, in practice, this cap can make open-ended funds less liquid for investors than they initially appeared in theory, especially if the fund is experiencing significant redemption requests. The ability to enter and exit these vehicles more frequently than closed-end drawdown funds may encourage investors to try to time the market, which is generally not prudent with private investments.
The enhanced frequency of being able to invest in and redeem from these vehicles can also amplify valuation considerations. More frequent mark-to-market, valuation requirements can lead to greater swings in underlying portfolio marks and overall performance calculations than those seen in traditional closed-end drawdown vehicles.
Investors may also be subject to unfavorable purchases or redemptions if NAVs are mispriced. NAVs are used to calculate management fees and carried interest for investors and, if mispriced, investors could be paying fees on unrealized gains that are later wiped out. Additionally, the challenge for GPs to efficiently deploy capital in evergreen and open-ended funds can lead to cash and/ or performance drag within the funds, as some portion of the fund may be allocated to public and/ or more liquid types of securities to support cash management and fund redemptions. Lastly, as open-ended vehicles allow for broader accessibility to private debt, investors need to consider how additional capital inflows and associated AUM growth will impact the asset classes.
In our experience, understanding these structures can help investors optimize their private debt allocations to align with their liquidity needs, risk tolerance, and investment goals. While offering several unique benefits, evergreen and/ or open-ended vehicles are not going to be appropriate for every investor or situation. Some investors prefer closed-end drawdown structures as they are more familiar with them, have a better understanding of how to navigate them, and/or are not comfortable with the considerations and risks of investing in other vehicle structures.
Although the count of evergreen and open-ended vehicles is increasing, we have observed that closed-end drawdown structures are still far more common across all of private markets, including private debt. Implementation and vehicle selection are important, but they are only a part of the evaluation process.
Below is a recent comparison of these structures:
Conclusion
Private debt has rapidly morphed from a niche opportunity to a strategic and critical component of investment portfolios. While NEPC believes private debt is here to stay, and that the current market environment presents a host of compelling investment opportunities, stakeholders must carefully monitor the associated risks.
Given the relative nascency of the asset class, its resiliency has not yet been tested over a full credit cycle. Similar to several other asset classes, in the event of a recessionary environment, some companies are likely to underperform and cause certain strategies and funds to experience heightened losses. For GPs, we believe the core principles of credit investing, such as prudent underwriting and rigorous portfolio management, remain crucial. To successfully navigate private debt portfolios, we believe that LPs need to be mindful of the asset classes’ complexities, the ever-evolving market conditions and the associated dynamics which can materially impact investment outcomes.
To learn more, please reach out to your NEPC consultant. We can help assess your specific situation and needs to determine an optimal private debt allocation. At NEPC, our private markets team works closely with clients so they can benefit from the illiquidity premiums on offer without compromising their liquidity needs. We encourage meeting with your NEPC consultant to discuss the investment potential in private debt today.
Sources
1According to SIFMA, 2024 Capital Markets Fact Book
2Preqin June 2024 Survey
3According to PitchBook, 2024 Annual Global Private Debt Report
4According to SIFMA, 2024 Capital Markets Fact Book
5According to PitchBook, How 10 Private Credit Firms Came to Manage a Third of the Industry’s Capital
Important Disclosures
Past performance is no guarantee of future results.
All investments carry some level of risk. Diversification and other asset allocation techniques do not ensure profit or protect against losses.
The information herein has been prepared by NEPC, an affiliate of Hightower Advisors, and should not be considered a recommendation to purchase or sell any investment or pursue any specific investment strategy. The information should not be relied upon to make any investment decision and does not take into account the investment objectives, financial situation and particular needs of the recipient. Recipients of the information presented herein should neither treat nor rely on such information as advice relating to legal, taxation or investment matters and are advised to consult their own professional advisors.
The opinions presented herein represent the good faith views of NEPC as of the date of receipt and are subject to change at any time. There can be no assurance regarding the accuracy of such views, including with respect to any forward-looking information or other commentary that is subject to uncertainty, future contingencies or other market factors. NEPC has prepared the information as general market commentary, market update and/or other general topics relating to portfolio construction and risk allocation. The information is not, and does not purport to be, a complete discussion of all relevant considerations, risks and other applicable factors.
The information in these materials has been obtained from sources NEPC believes to be reliable. While NEPC has exercised reasonable professional care in preparing this report, we cannot guarantee the accuracy of all source information contained within. Neither NEPC nor any of its affiliates has any obligation to update the information contained herein. The performance information of any indices or strategies represented herein is based on third-party sources, and such performance information does not necessarily represent the performance or experience of any NEPC client.
These materials identify potential benefits relating to NEPC’s services to its clients and/or its commentary regarding current market events and portfolio construction considerations. Any NEPC investment strategy also is subject to certain risks and limitations. Although NEPC believes it and its personnel may have certain competitive advantages regarding portfolio construction and management. There can be no guarantee that NEPC will be able to maintain such advantages over time, outperform third parties or the financial markets generally, implement its investment strategy or achieve its investment objectives for a client or avoid losses.