It’s that time of year again – leaves are falling, students have settled into a new school year, and for those of us in the Endowment world, the largest endowments are releasing fiscal year-end investment returns. While we at NEPC don’t recommend measuring your performance against peers on an annual basis, we will be the first to admit that we can’t wait to see how the $41 billion goliath Harvard performed or to dig into how David Swensen is positioning the Yale portfolio. Notably, odds are that your endowment or foundation has a drastically different investment program from these multi-billion dollar mega funds that dominate the headlines.
In this past fiscal year ending June 30, 2019, the typical endowment returned about 5.1% net of fees. Interestingly, this ranks near the bottom of large endowments that have published results. These large endowments have an average value of $12 billion, almost 100 times larger than the $135 million average fund in the Investment Metrics database.
2019 Fiscal Year Endowment Performance
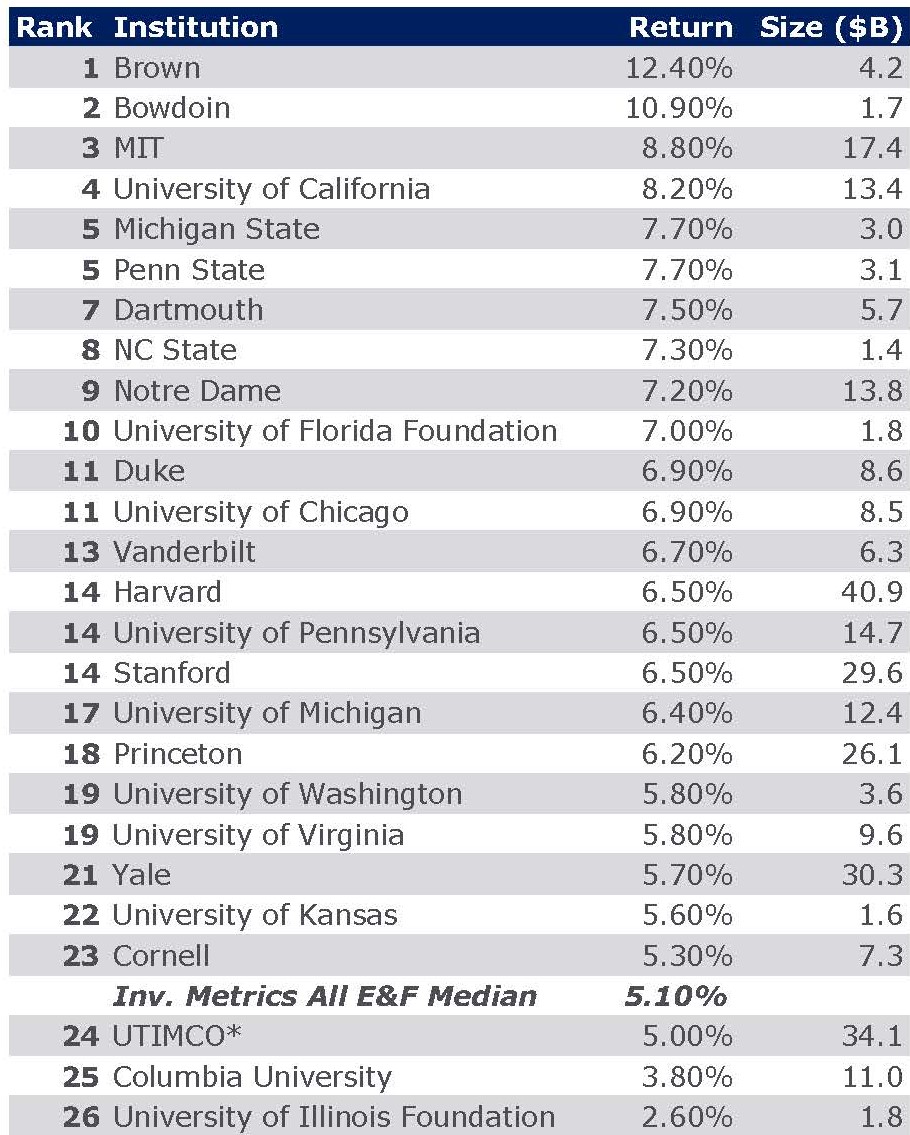
*UTIMCO figures are for combined Permanent and Long-Term Funds
Source: Investment Metrics, Respective Endowment Press Releases
Why did the largest Endowments generally outperform smaller institutions last year? Are their dedicated investment staffs finding better investments? Are they better-positioned than their smaller peers?
Brown University, the smallest Ivy League endowment, was the top performer of all institutions we tracked. The Providence, Rhode Island school primarily credits its managers for helping them outperform their benchmark return by over 6% this fiscal year. They cite strong performance and downside protection during the fourth quarter’s volatility. Bowdoin College, number two on the list, has been more tight-lipped. The college elects not to share asset allocation figures or asset class returns, but CIO Paula Volent has previously attributed outsized performance to young, emerging managers and Bowdoin’s success in gaining access to top-tier funds.
While we are not surprised to see manager alpha driving single-year returns at the top of the list, and we think talented teams can identify superior managers, our gut says that asset allocation was the main driver of 2019 fiscal year mega fund outperformance. In our estimation, the mega funds outpaced 2019 fiscal year peer averages due to their larger footprint in private markets. As shown in the chart below, Venture Capital and Global Private Equity were the strongest performing asset classes. At the start of the year, endowments with more than $1 billion in assets had approximately 6% more invested in venture capital funds compared to the average endowment and an additional 6% in more traditional private equity funds1. In addition to a higher allocation to private markets, the larger institutions tend to have mature programs that are out of the J-Curve, while other institutions may still be building towards strategic targets.
1-Year Asset Class Returns (periods ending 6/30/19)
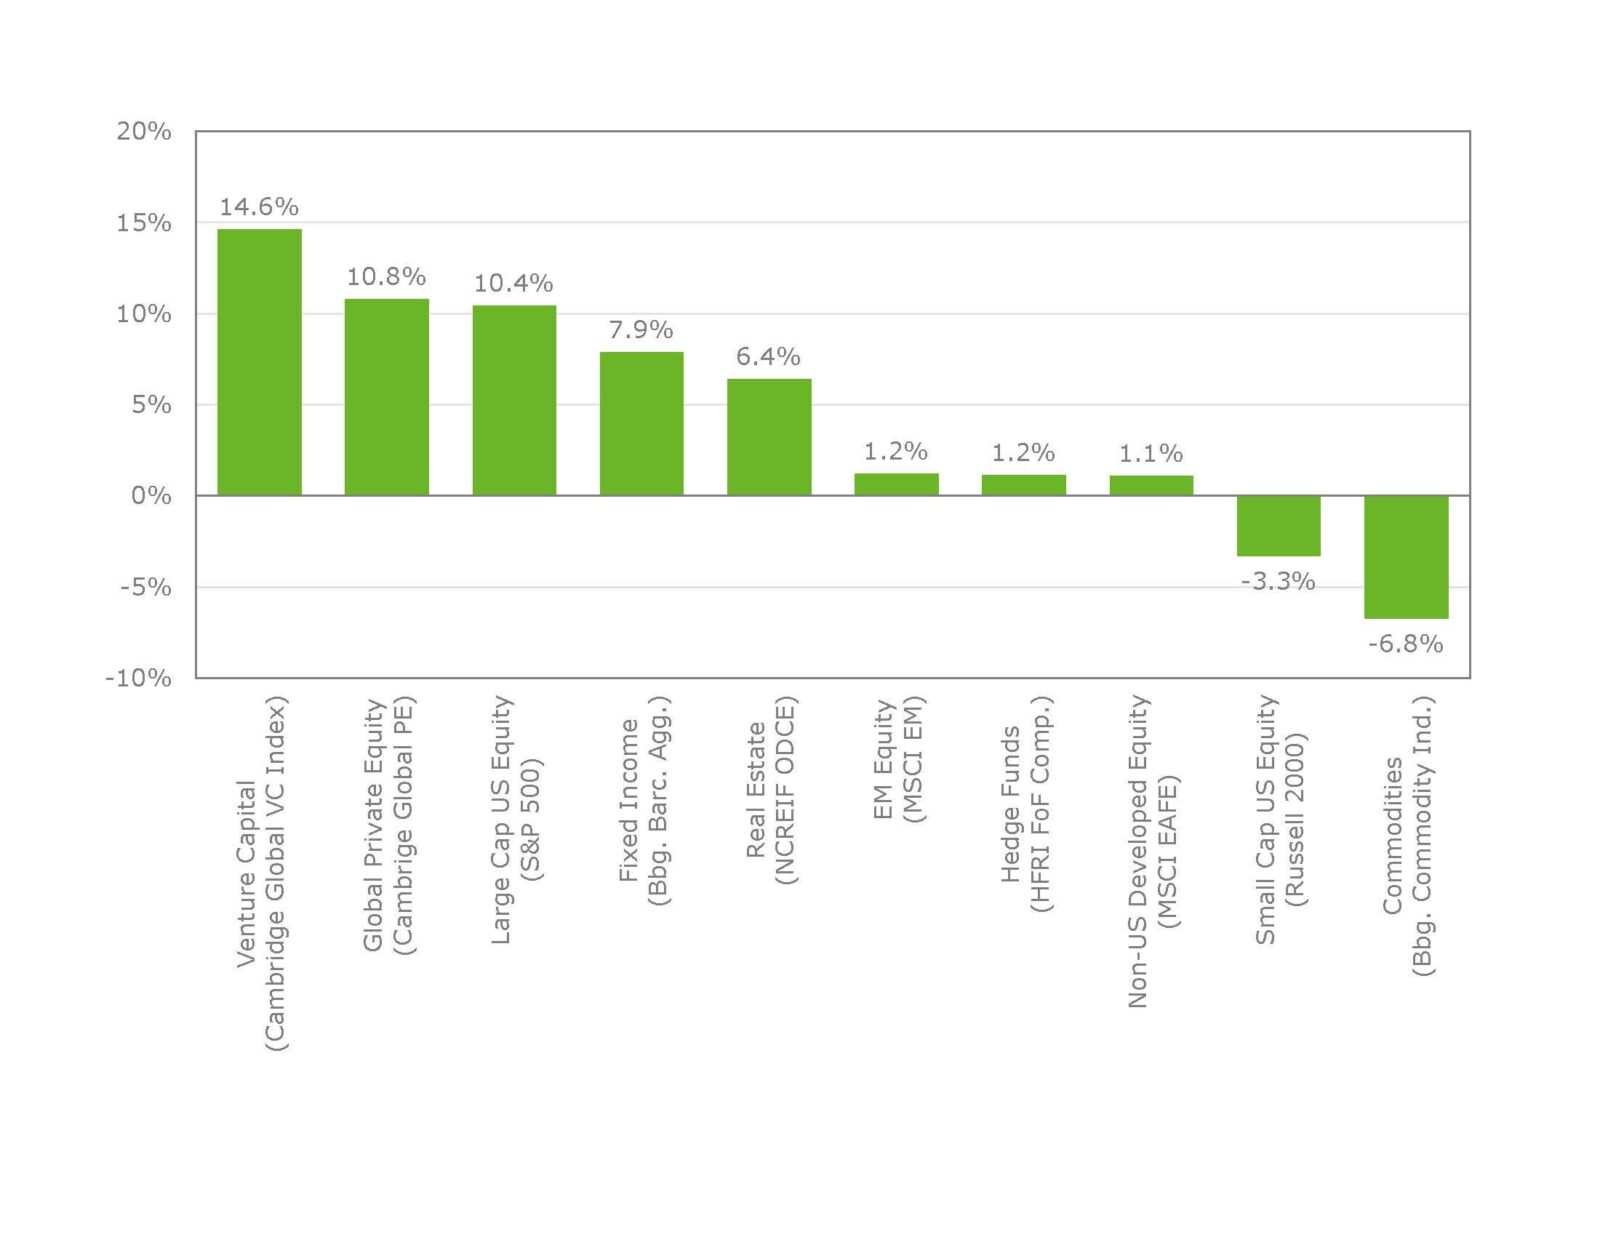
Source: S&P, Russell, MSCI, Bloomberg, NCREIF, ThomsonOne/Cambridge Associates, Factset
But what about Yale? Their 5.7% annual return sits at the lower end of the spectrum relative to large peers, despite a 38% target to leveraged buyouts and venture capital2. While we don’t know for sure, low exposure to U.S. public equities may be weighing on returns. Yale has only 2.75% targeted to the asset class. Despite relative underperformance to large peers in the past year, Yale’s returns still topped the average endowment.
At NEPC, we believe that Private Markets will continue to play an important role in well-diversified endowment programs, and many institutions can learn from what the top programs are doing. Early movers into private markets have benefitted from tail winds for the past 20-plus years. Additional capital flowing into Private Markets, high purchase multiples and ample use of leverage make investments in the asset class riskier today in many ways. Nonetheless, as we look forward, we expect private markets to be amongst the highest returning asset classes.
To help combat current risks, we recommend institutions set a target to private markets that matches their institutional goals and objectives, and implement the target through a strategic plan. The strategic plan should not only diversify the portfolio by strategy type and vintage year, but also address potential liquidity needs in the event of a stressed scenario. Our Total Enterprise Management model can assist in this goal-setting and risk management process.
At NEPC, we are continually looking for the next great market opportunity. Despite the strong investor demand for private market investments, we are still able to find idiosyncratic opportunities in narrow corners of the market such as agricultural technology and “last mile” industrial real estate. Manager selection within the space is paramount, and our rigorous process works to identify teams that can capitalize on opportunities in an increasingly complex investment landscape. To learn more about how we can help you develop your Private Markets program, please contact your NEPC consultant.