{{cta(‘27383b43-e339-4cb3-81d5-09b072475cf5’)}}
Within fixed income, municipal bonds may offer a silver lining for ultra-high-net-worth investors fretting over the possibility of the Treasury yield curve inverting.
While the Treasury curve has continued to exhibit a flattening trend, taking it closer to an inversion, the municipal curve has marched to a different beat, even steepening slightly in 2018 (Exhibit 1). The difference is apparent, especially when using a tax adjusted municipal curve to get a taxable equivalent yield (TEY) (Exhibit 2). In fact, the relative slope between Treasuries and municipal debt is hovering around a record high (Exhibit 3), leading us to believe that municipal bonds are an attractive option for wealthy taxable investors relative to other fixed-income opportunities.
Exhibit 1: US Treasury Yield Curve vs Municipal Yield Curve
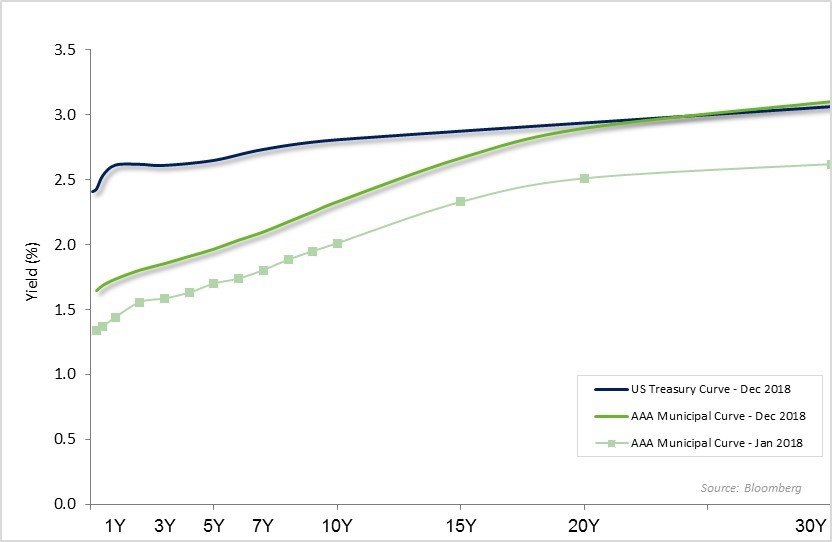
Source: Bloomberg
Exhibit 2: US Treasury Yield Curve vs TEY Municipal Yield Curve
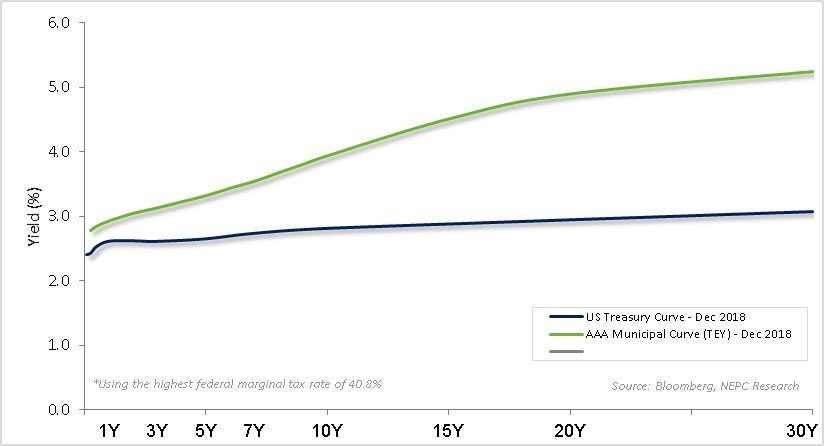
Source: Bloomberg, NEPC
Exhibit 3: Delta Between Muni and Treasury Yield Curve Slopes
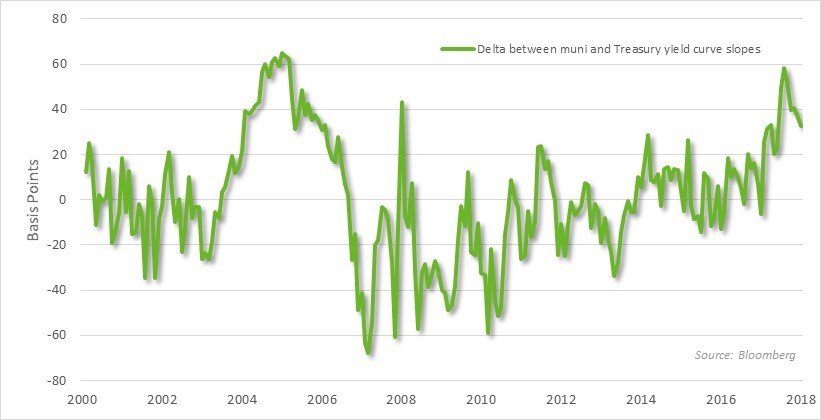
Source: Bloomberg, NEPC
The Federal Open Market Committee’s rate increases over the last three years have raised the front-end of the Treasury yield curve while the longer-end of the curve hasn’t kept pace. This dynamic has caused the curve to flatten, landing it at the precipice of inverting. Historically, every recession since 1980 has been preceded by an inverted yield curve (Exhibit 4), an instance when the 10-year Treasury bond is lower than that of two-year bond. While this is yet to happen–the Treasury yield curve spread is currently at 19 basis points, the narrowest margin since 2007–we are paying close attention. If this measure turns negative, it may likely warrant a more bearish market view.
Exhibit 4: Historical Yield Curve Spread
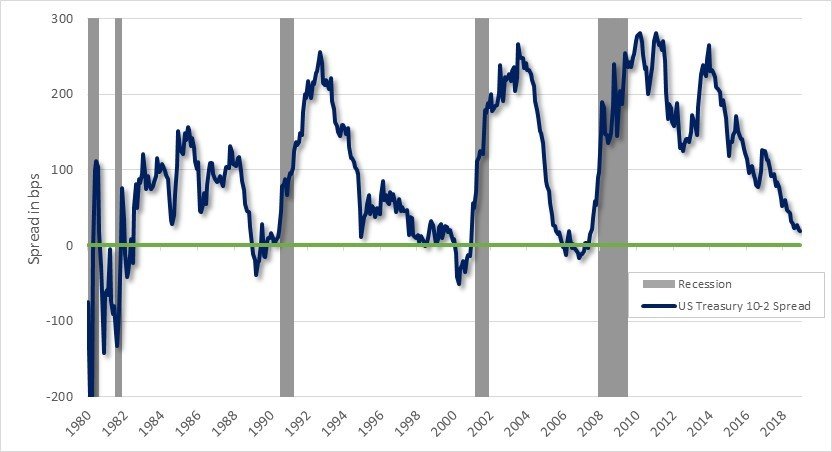
Source: Bloomberg, NEPC
To be sure, there is always the possibility that a recession may not occur in the event of an inverted yield curve. That said, over the years it has been a reliable harbinger of an economic downturn. Also, it has been 10 years since the US economy experienced a significant downturn and 17 years since a more “normal” cyclical recession.
While the shape of the yield curve isn’t necessarily what causes a recession, it can be viewed as a symptom of one. For instance, when investors no longer receive a higher yield for holding a longer-dated bond relative to one with a shorter maturity, the market is ascribing greater risk to the economy in the near term than, say, 10 years from now.
Taxable investors should keep in mind that the yield curve of muni bonds doesn’t carry the same economic predictive power as the Treasury curve but there are investment implications that one should pay attention to, such as investors currently ascribing value to the longer end of the muni yield curve. The current spread differential between two-year and 10-year municipal bonds is 52 basis points, almost three times that of the 19-basis point spread differential between two-year and 10-year Treasuries.
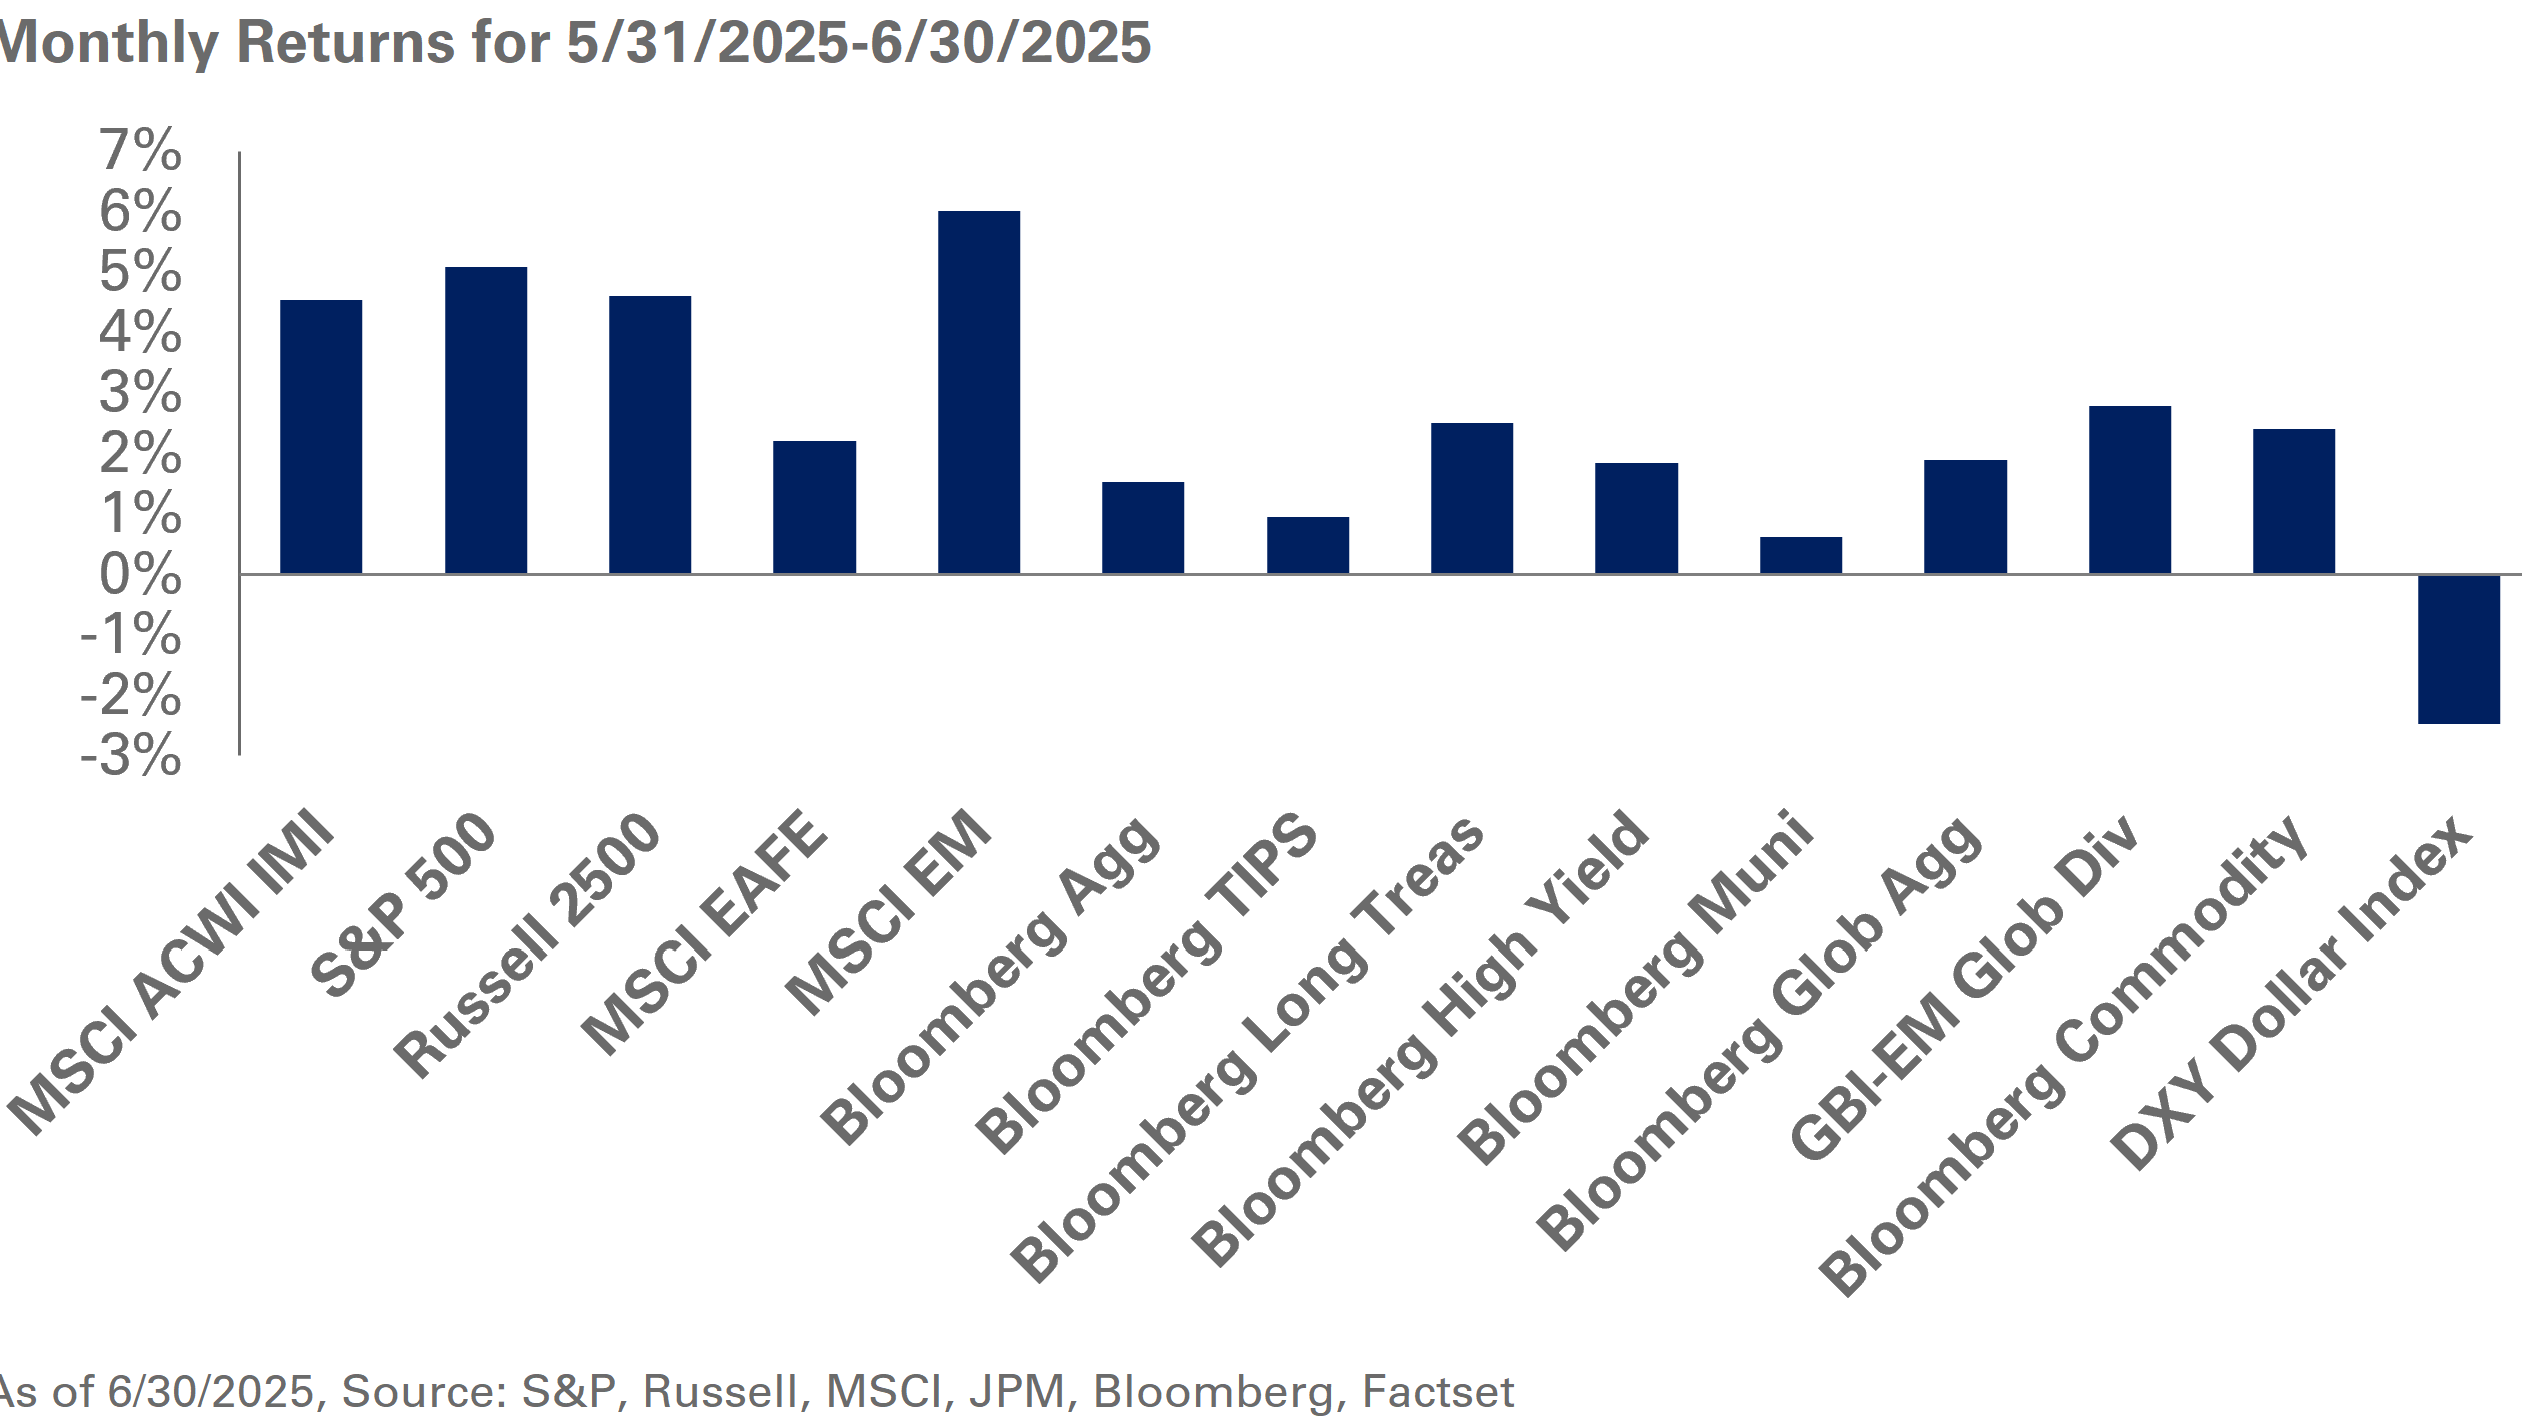
The yield curve isn’t the only place where municipal bonds have displayed resilience. While returns in 2018 were modest, municipals outperformed almost all other asset classes, including other segments of the fixed-income market, global equities and traditional safe-haven assets such as gold (Exhibit 5).
Exhibit 5: 2018 Returns for Asset Classes
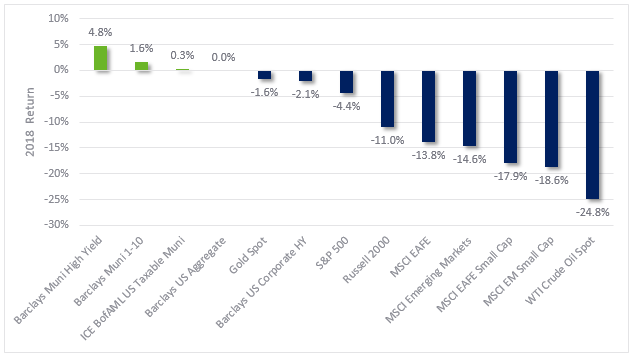
Source: Bloomberg
We continue to believe that municipals are an attractive investment for taxable investors relative to other fixed-income opportunities. Fundamentals remain on solid footing and the increase in interest rates has reset yields to higher levels, offering the potential for higher returns over the longer term.