With the longest economic expansion on record currently underway in the United States, it is hard to imagine that capital markets and investments were in utter disarray a little over ten years ago. Or that technology stocks—the darling of equity markets today—took a severe beating two decades back.
At NEPC, we believe that when the going is good (and has been for an extraordinarily long time), it is prudent to rebalance investment portfolios away from high-performing assets, especially at this late stage of the economic cycle. After all, a market correction can significantly decimate the value of risk assets. Still, for many high-net-worth individuals and families it is an anxious process as paying taxes can take a significant bite out of returns. However, large unrealized gains should not override the principles of portfolio management. Also, pairing this rebalancing with any portfolio losses can help lighten the tax load.
To be sure, we see no evidence to suggest a recession is imminent. We believe the late phase of an expansionary economic cycle can persist into the foreseeable future, bolstered by accommodative monetary policies, enabling investments to perform robustly in this environment. However, the potential outcomes associated with the late phase of a market cycle are more negatively skewed and the universe of potential investment opportunities has shrunk following the prolonged rally. As a result, our message is a bit more defensive.
Our recommendation to rebalance to under-performing assets comes amid a string of impressive wins by financial markets; over summer, the S&P 500 Index topped 3000 for the first time. Using total market capitalization to GDP, a valuation method to gauge if the market looks expensive, reasonably valued or outright cheap, we find the metric hovering around 160%—it troughed in 2009 near 60%—indicating that the total value of U.S. public stocks is approaching that of the dot.com bubble around 20 years ago (Exhibit 1). The higher the total market capitalization to GDP metric, the lower the subsequent 10-year return, data show. This implies muted returns for the next decade, underscoring the need to rebalance high-performing risk assets. That said, the impact of dramatically lower interest rates, such as those prevailing today, on valuations is profound as they are an important input in conducting any price evaluation. Therefore, comparing valuations of the dot.com bubble era and the present day should incorporate those interest rate differentials.
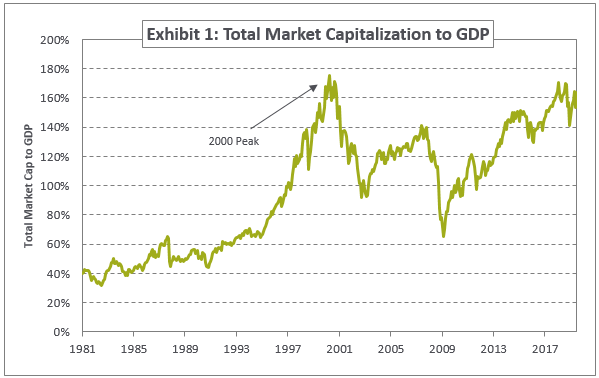
Source: Kailash Capital, LLC, Russell, Compustat; data from 12/31/1980-6/30/2019
While the great financial crisis led to a prolonged period of unprecedented monetary easing by central banks the world over, it also disrupted the longstanding tradition of value stocks besting growth equities.
Historically, value investing outperformed growth equities as investors tend to bid up fast-growing, exciting companies—like those in the technology sector—while overlooking the stodgier but stable firms. But much to the frustration of investors, value stocks have been languishing in the shadow of growth equities for the past decade. Growth stocks are typically pricier than value equities, but they traded at lower multiples in early 2009. Meanwhile, financials—a staple of value investors—came under fire for the role they played during the crisis, triggering restrictions from regulators that dampened future profitability, setting the stage for the outperformance of growth over value.
We examined 10-year returns of the top five companies in the Russell 1000 in each of the value and growth categories. Within growth stocks, the market capitalization of the top five companies—Microsoft, Apple, Amazon, Facebook and Alphabet—represents over 20% of the total GDP of the United States; the only other time this level has been exceeded is at the height of the dot.com bubble in 2000 (Exhibit 2).
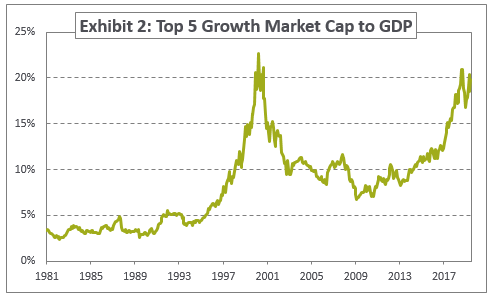
Source: Kailash Capital, LLC, Russell, Compustat; data from 12/31/1980-6/30/2019
For value stocks, the market capitalization of the top five—Berkshire Class B, JP Morgan, Exxon Mobil, Johnson & Johnson and Proctor & Gamble—is elevated but lower than the peak in 2000 and, on a relative basis, not in the same vicinity as the Russell 1000 Growth Index (Exhibit 3).
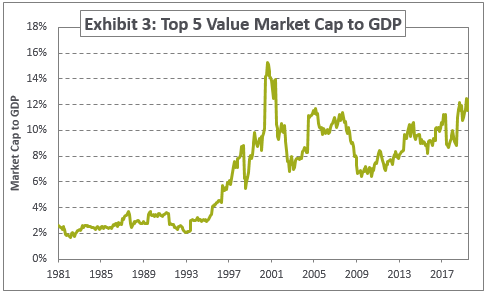
Source: Kailash Capital, LLC, Russell, Compustat; Data from 12/31/1980-6/30/2019
As we mentioned earlier, comparing valuations between the dot.com bubble and the present day should incorporate interest rate differentials, given the current low-interest rate environment. Still, one cannot deny that valuation of growth stocks in the late 1990s and early 2000 are eerily similar. One other factor to keep in mind: In the late 1990s, companies filed initial public offerings at a very early stage, with many yet to turn a profit and, at times, void of any meaningful source of revenue. Today, companies are going public later, with a longer track record of operations and revenue. These companies can carry hefty valuations. For instance, Uber’s IPO raised over $8 billion, indicating a company valuation of over $82 billion; competitor Lyft had a valuation of $24 billion on the day of its IPO. These large valuations ensure the immediate entry of these pre-profit companies into the major market indexes as soon as they go public, further skewing price-to-valuation metrics. On the other hand, several IPOs have been withdrawn recently as some private valuations aren’t being well received in the public market arena.
At NEPC, we understand that these years of underperformance—particularly during a period of robust economic expansion—are a challenge for investors. We believe it would be a mistake to write off investing in value stocks. After all, we’ve been here before: The exuberance over technology companies in the 1990s led to growth overshadowing value for most of that decade. Investors wondered if value would ever stage a comeback, only to have value soundly beat growth for eight straight years on the back of the bust of the dot.com bubble. It took a mere six months for growth stocks to give back the outperformance of that decade. Following the relative trough in 2008, growth stocks then took more than a decade to get back to breakeven in 2018. Furthermore, the balance of power could shift given a slowing technology sector, and a resurgence in energy, financials and materials.
In any event, we encourage our clients to not give up on investing in value stocks. We believe the outsized performance of growth may be an appropriate funding source to rebalance assets. We believe there is a strong case for balance and diversification within portfolios in the late phase of a market cycle amid the greater potential for an adverse economic outcome should the landscape suddenly change. And rebalancing gains in conjunction with losses can take some of the sting out of taxes, while positioning the portfolio to weather the next economic downturn.