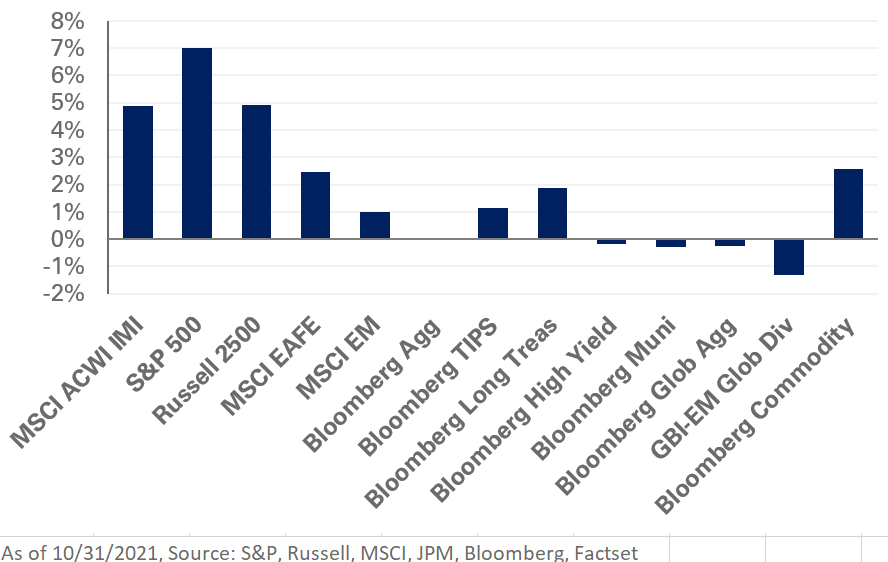
U.S. equities moved higher in October as strong corporate earnings and a relatively positive macroeconomic backdrop pushed the S&P 500 Index to a record high, with the index gaining 7% last month. During this period, non-U.S. equities were also in the black as a rebound in Chinese assets and dollar weakness supported returns, with the MSCI EAFE and MSCI Emerging Markets indexes returning 2.5% and 1%, respectively; notably, the MSCI China Index increased 3.2% in October as mega-cap names bounced back from last quarter’s lows caused by a string of recent regulatory actions.
Meanwhile, the U.S. yield curve flattened last month, with the 10-year Treasury yield rising three basis points to 1.55%, while the 30-year Treasury yield fell 15 basis points to 1.94%. As a result, long-duration assets outperformed, leading to gains of 1.9% for the Barclays Long U.S. Treasury Index.
Inflation concerns weighed on fixed-income markets as upward pressure in energy prices and supply chain issues continued. The 10-year U.S. breakeven inflation rate rose 14 basis points to 2.51%. Despite the increase, market pricing still suggests a relatively muted inflation outlook over the long term.
In real assets, commodity prices pushed higher as strong demand and continued supply constraints cascaded through markets. Spot WTI Crude Oil posted an 11.1% increase for the month – pushing year-to-date gains to 72.8%. Futures curves remain in backwardation—when the futures price of a commodity is below the current spot price—across the energy sector, underscoring market expectations that commodity prices will normalize in the near term.
While the environment remains supportive for equities, credit spreads in the public-debt space imply muted forward-looking returns. As a result, we recommend reducing exposure to lower-quality credit. At the same time, we caution investors to brace for potentially higher inflation relative to market expectations and suggest adding large-cap value exposure to U.S. equity to help mitigate the impact of rising interest rates on portfolios.